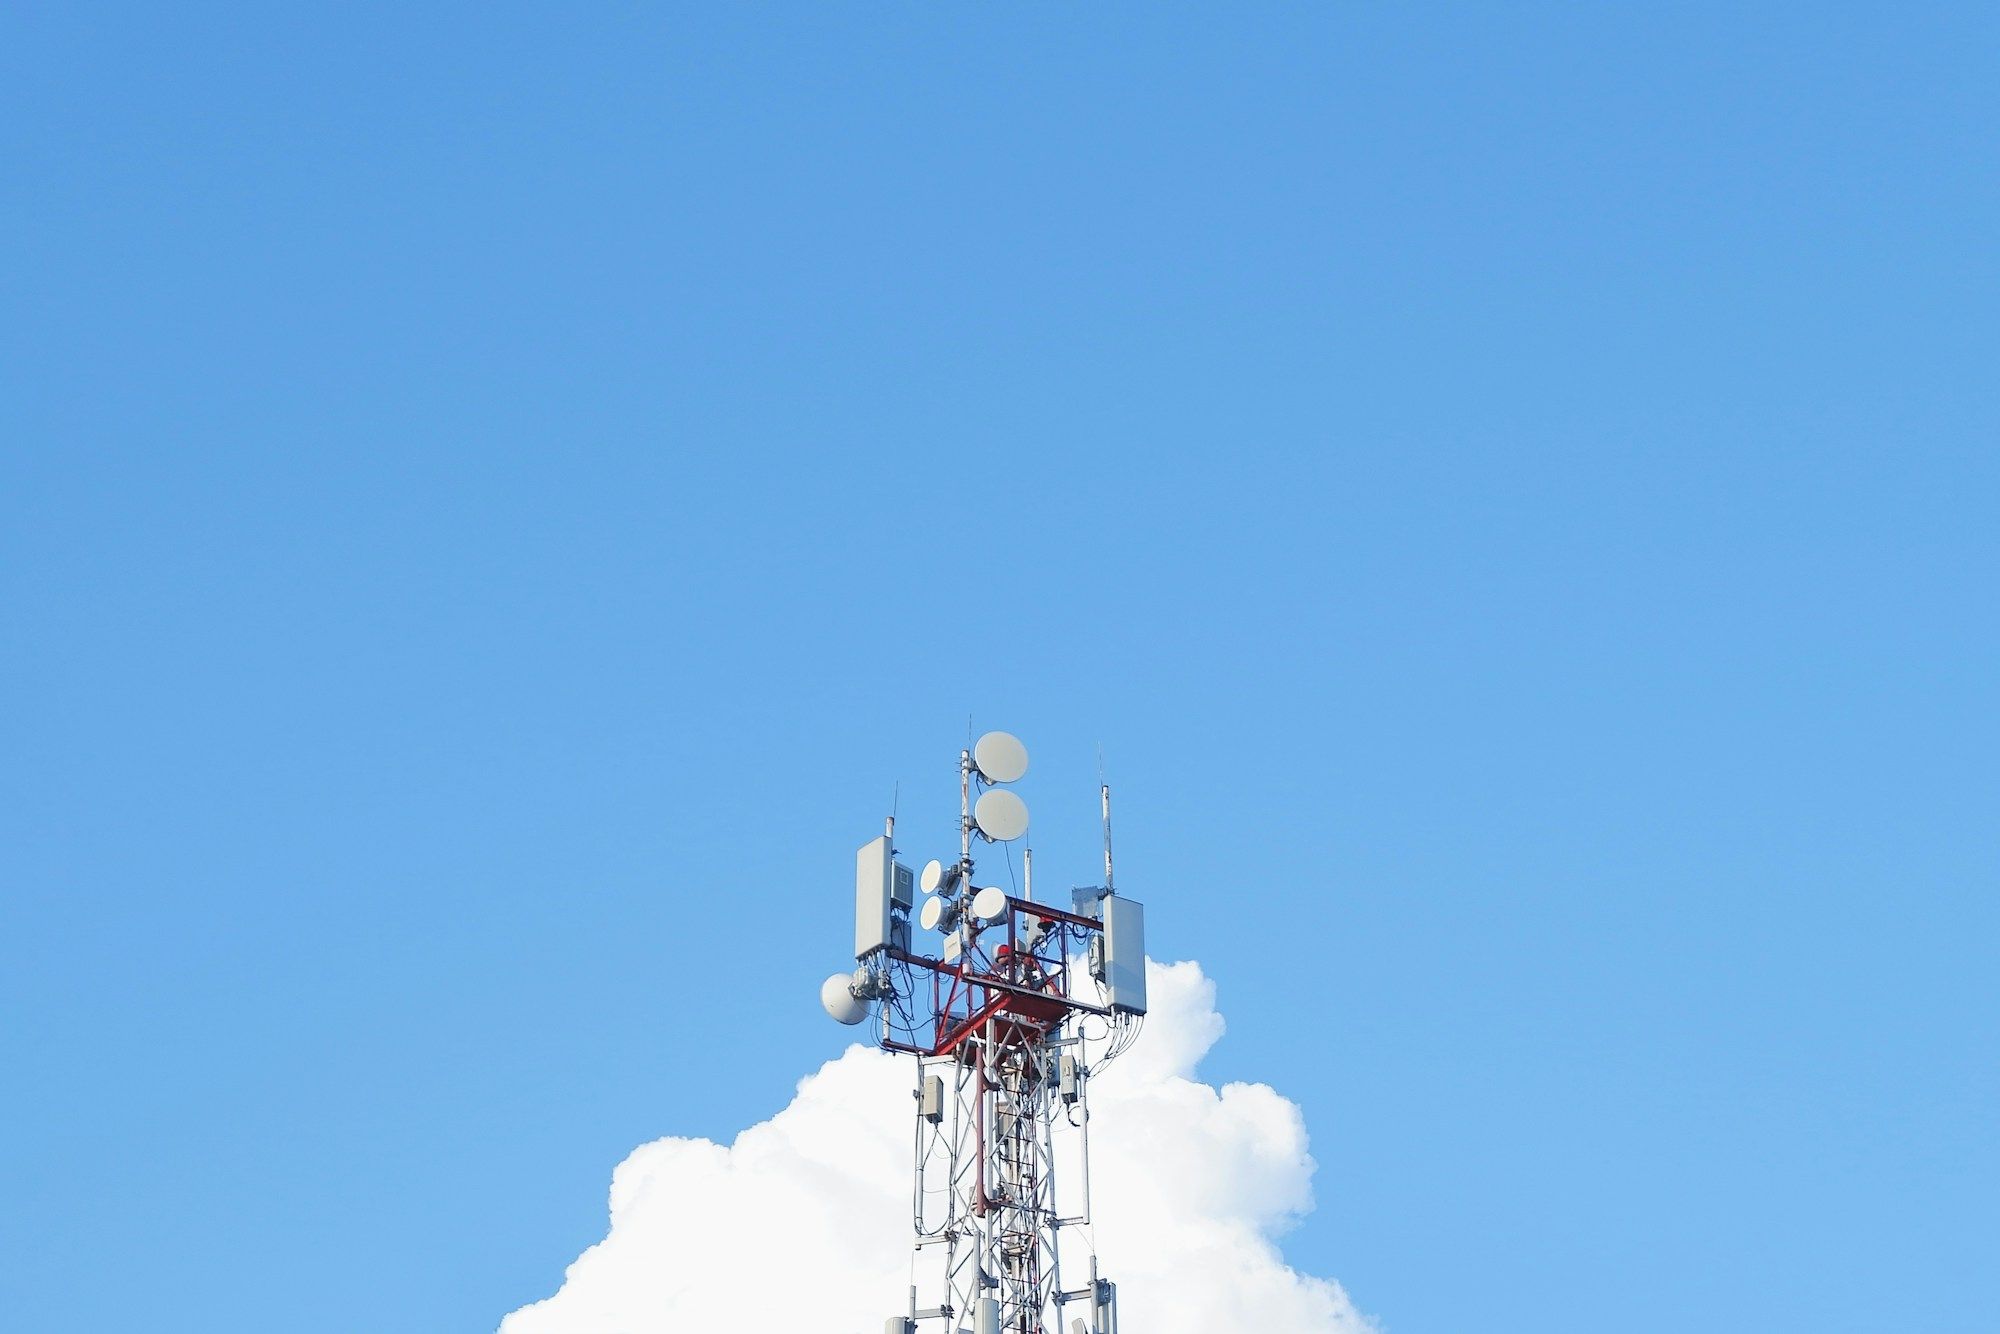
Two lattice telecom towers against a deep blue sky with wisps of cloud and a vapour trail.

Illustrative imagery Confidential

Telecom & media20259–12 months

Coverage, content and care on one intelligence layer

Client: A mobile network operator

Read the story
  • Technology & Intelligence
  • AI Design
  • Marketing Technology

At a glance

The brief. Give network, marketing and care one version of the truth.

Client
A mobile network operator
Year
2025
Duration
9–12 months
Scale
Network, marketing and care

What each discipline did

  1. 02Technology & Intelligence

    Shared data platform and metrics layer

  2. 04AI Design

    Care assistant with agent hand-off

  3. 06Marketing Technology

    Registered messaging and preferences

From brief to result

Definitions before dashboards. How the shared layer was built.

The brief in full, how we approached it, what we built and what it set out to change.

The brief, in full

Network, marketing and customer care each had their own numbers for the same customers. Care could not see a local outage, marketing could offer an upgrade where there was no coverage, and every report began with an argument about whose figure was right.

The brief: give network, marketing and care one version of the truth.

Our approach

We started with definitions, not dashboards: one metric catalogue agreed by all three teams, each metric with an owner and its lineage. The shared data layer was built to serve those definitions, and every dashboard reads from it.

On that layer sit a care assistant that can see network status, with a hand-off to an agent, and registered, consented messaging that knows where coverage is.

How it ran

  1. Weeks 1–6Definitions

    The metric catalogue, agreed by network, marketing and care.

  2. Months 2–6Platform

    The shared data layer and the dashboards that read from it.

  3. Months 5–9Assistant

    The care assistant, its eval set and the hand-off to an agent.

  4. Months 7–12Messaging

    Registered messaging and the preference centre, checked against coverage.

What we built

A shared data layer and metric definitions used by network, marketing and care, feeding a care assistant and registered, consented customer messaging.

What it left behind

  1. Data platform and metric catalogue
  2. Care assistant and eval set
  3. Preference centre
  4. Operational dashboards

What changed

The layer is built so network, marketing and care read the same figures from the same place: the care assistant answers with live network status and hands over to an agent when it should, and offers are checked against coverage before they are sent.

This programme is confidential: its figures are shared only under NDA.

How it is measured

Picture story

From the mast to the help desk. One network, three teams.

The pictures on this page are illustrative: licensed stock photography and code-built mock-ups chosen to show the setting, not the client’s own work. Credits are at the foot of the page.

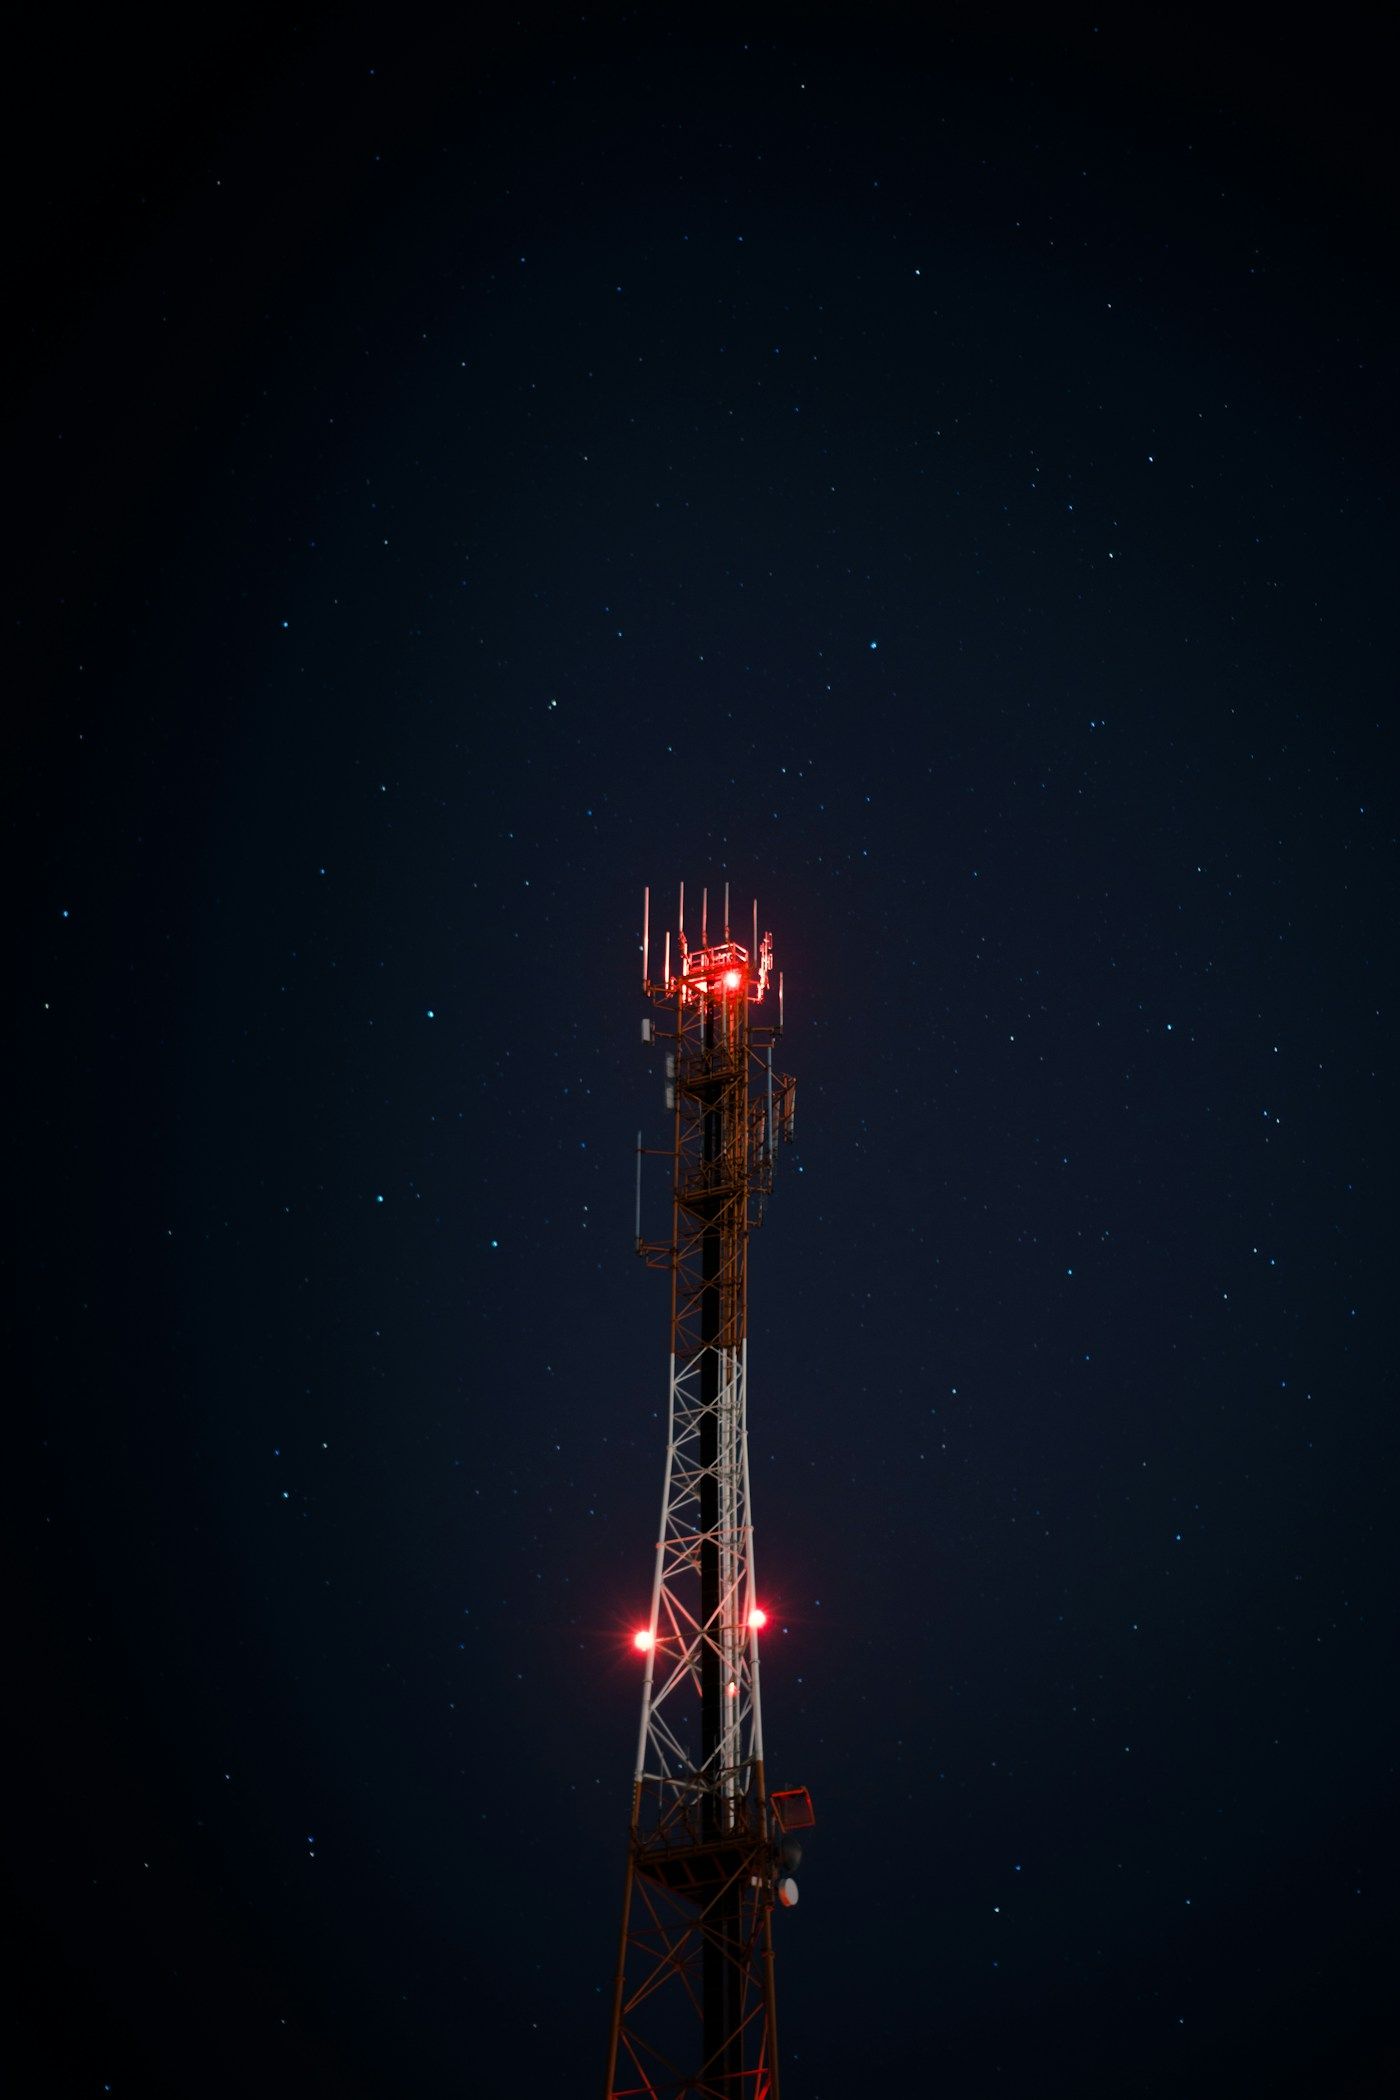
A telecom mast lit with red warning lights against a dark night sky.
Fig. 01Network status, live.Joshua Slate on Unsplash (opens in a new tab)
A bundle of optical fibres glowing blue and white against a dark background.
Fig. 02One data layer under every team.Denny Müller on Unsplash (opens in a new tab)
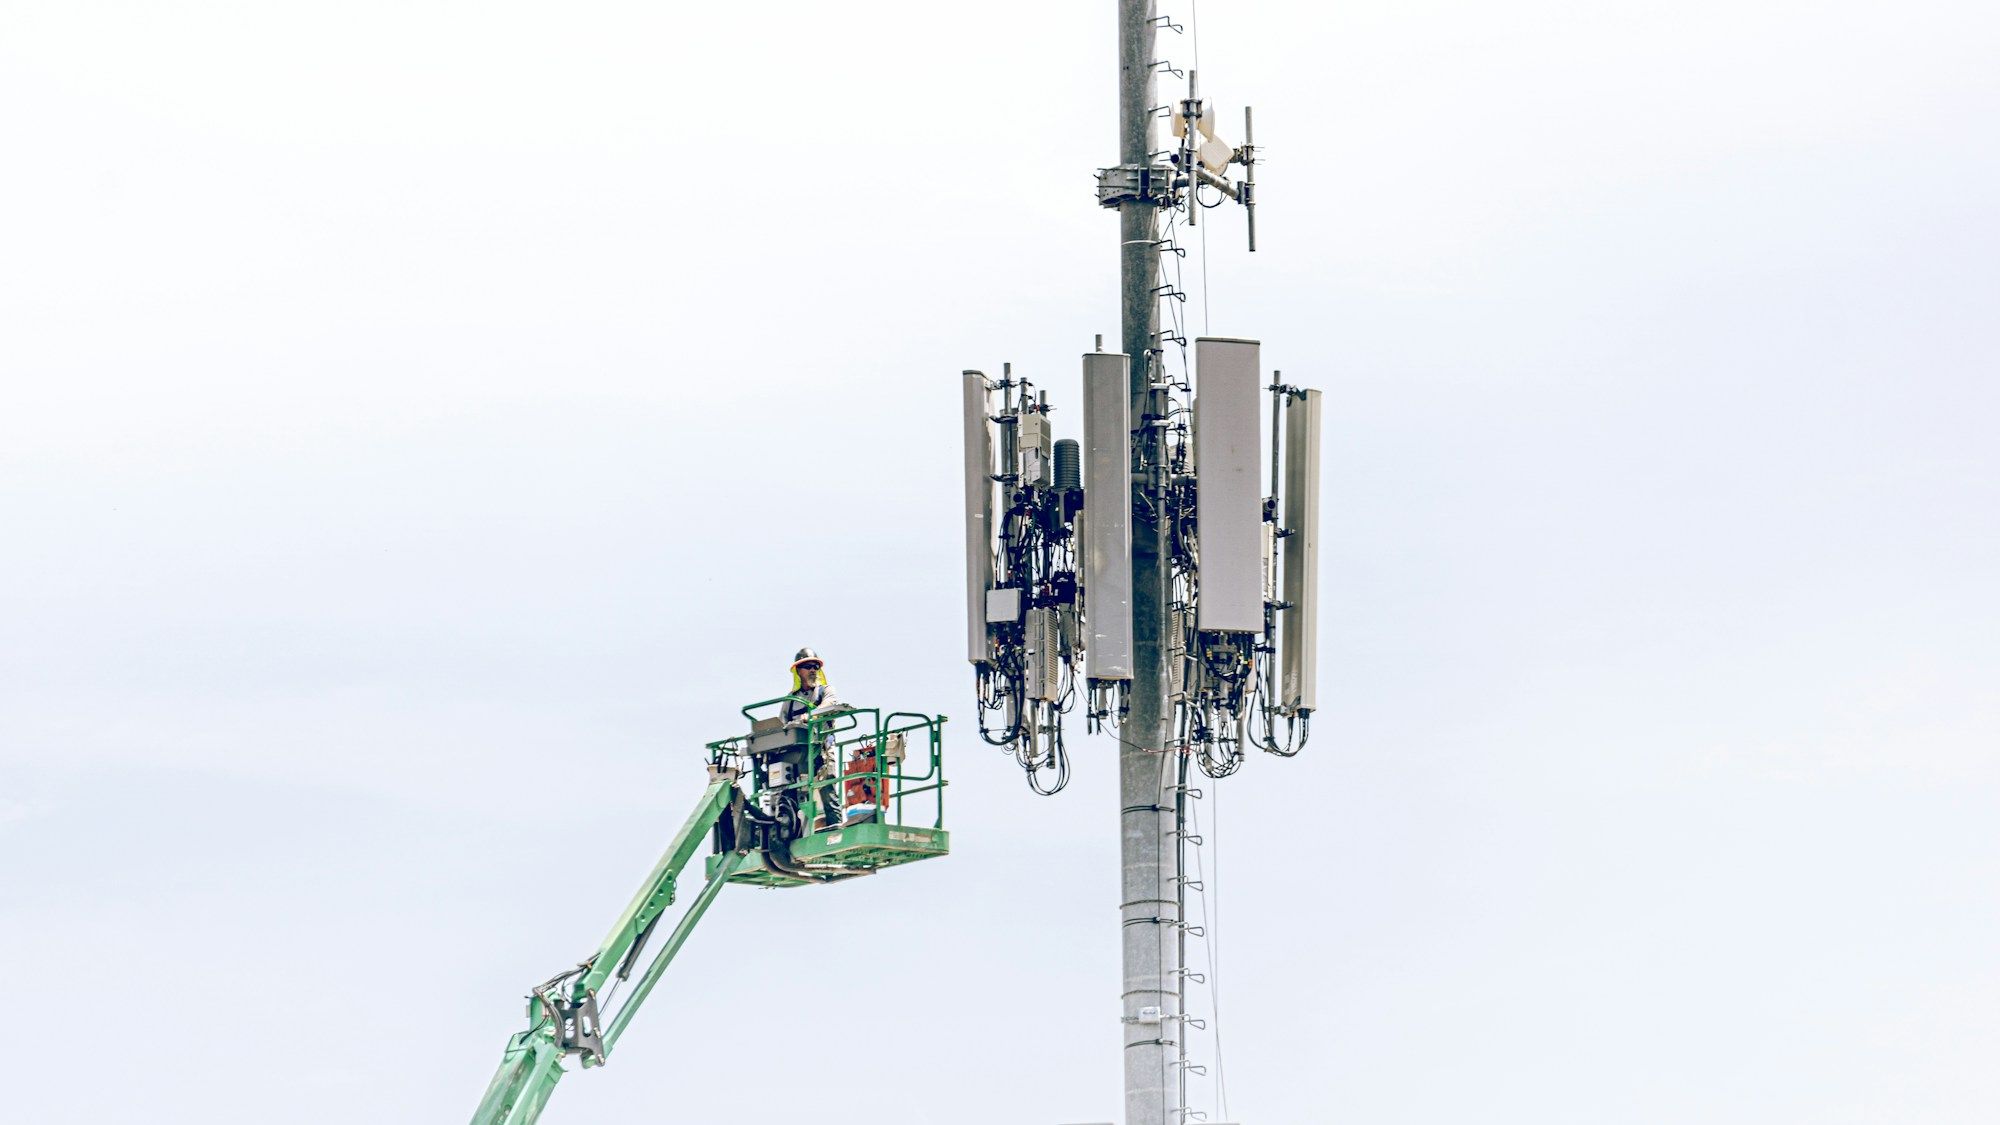
A technician on a lift platform works on the antennas of a cellular mast under a pale sky.
Fig. 03Field engineering and care read the same outage.iStrfry, Marcus on Unsplash (opens in a new tab)
A smiling customer-care agent in a headset at her desk, colleagues working behind her.
Fig. 04Care sees the network before the customer has to explain it.BaljkanN4 on Unsplash (opens in a new tab)
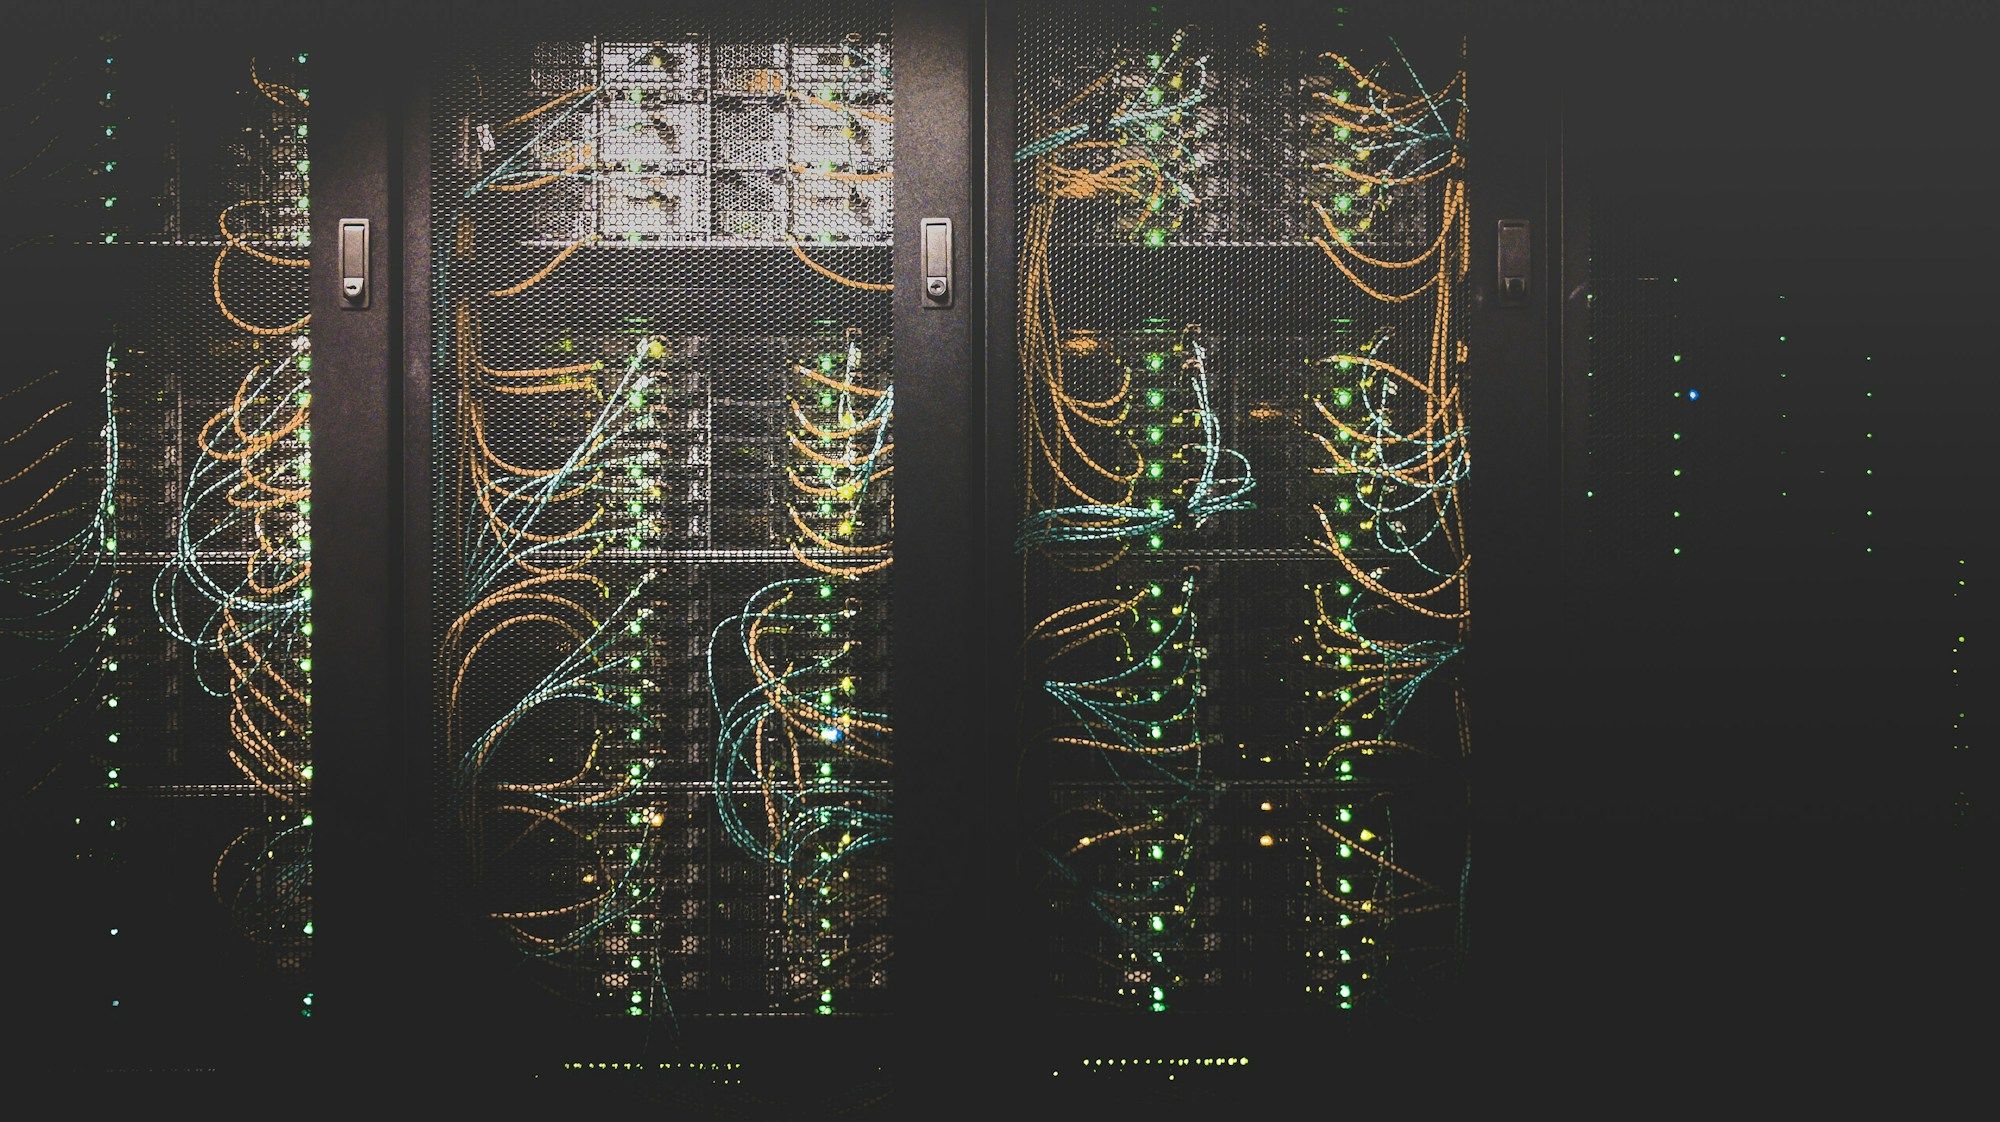
Server racks in a dark room, their cables in yellow and green bundles.
Fig. 05Metric definitions with owners and lineage.Taylor Vick on Unsplash (opens in a new tab)
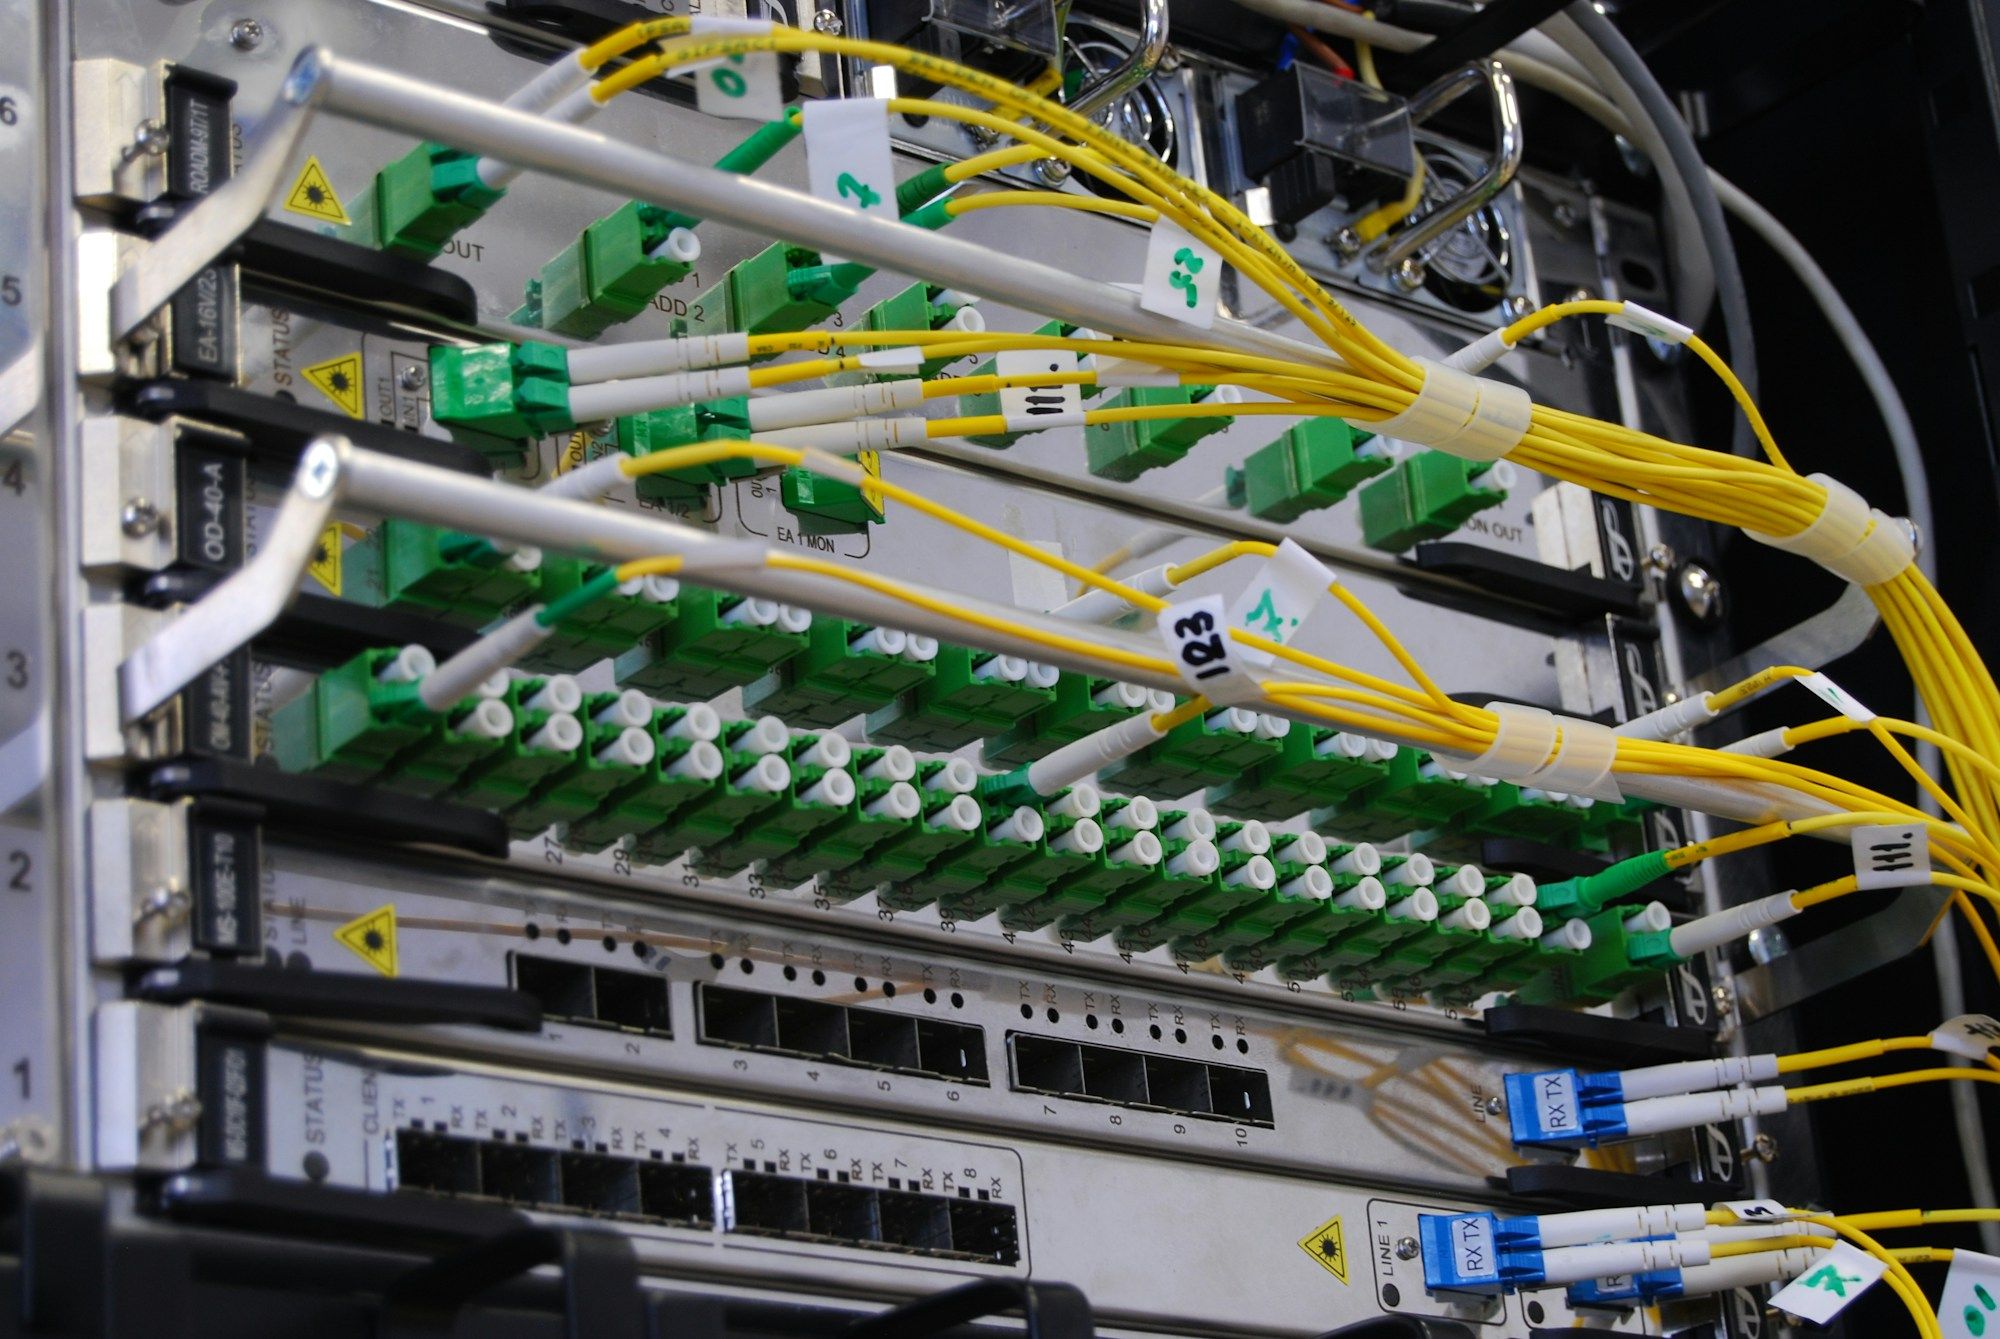
Yellow fibre-optic patch cables plugged into the green ports of a network switch.
Fig. 06Events from the network, joined to the customer.Kirill Sh on Unsplash (opens in a new tab)

More pictures 1

  • A red and white telecom mast rising out of a white cloud into a clear blue sky.

Under NDA

Shown in a walk‑through, not on this page.

This programme is confidential, so the client’s own artefacts stay off the website. Once an NDA is signed, we walk you through each of them, with the figures.

Withheld here

  • 2 screens from the product
  • Every result figure
Ask for a walk-through under NDA

Illustration: a stack of sealed folders, one for each kind of artefact withheld, each marked “Under NDA”.

Outcomes

Judged on shared figures. Read under NDA.

This programme is confidential. Its figures and the client’s own artefacts — screens, before-and-after views and brand kit — stay off this page and are shared under NDA.

The measurement plan

  1. Self-service resolution rate

    Compared with
    The quarter before the assistant launched
    Read
    Monthly
    Result
    Under NDA Reported by The client’s care operations team
  2. Contacts per thousand subscribers

    Compared with
    The same months the year before
    Read
    Monthly, by region
    Result
    Under NDA Reported by Care and network analytics
  3. Offer accuracy across channels

    Compared with
    Offers sent before the coverage checks
    Read
    Each campaign
    Result
    Under NDA Reported by Marketing operations

Results

  • Withheld — shared under NDASelf-service resolution rate
  • Withheld — shared under NDAContacts per thousand subscribers
  • Withheld — shared under NDAOffer accuracy across channels

Withheld — shared under NDA

Ask for a walk-through under NDA

Credits

The team and the pictures.

People are named only with their agreement.

Team 9 people

  • Programme lead × 1
  • Data architects × 2
  • Data engineers × 3
  • AI engineer × 1
  • Analysts × 2

Credits

Strategy, design and engineering
Xterra Edze
Screens and before-and-after views
Xterra Edze (code-built illustrations)
Photography
Licensed stock from Unsplash, credited picture by picture

Next case · 08 · Consumer health

Global content production from one source

Make each asset once, then adapt it for every market.

Read the next case

Let’s build what happens next.

Tell us what you’re building. We’ll answer straight.

Book a discovery call

Three ways to start

  1. 01About 2 minutes

    A quick question

    You get A reply from a lead, not a sales queue

  2. 02About 8 minutesMost useful

    A project brief

    You get Options and a first scope after one call

  3. 03About 15 minutes

    A formal RFQ or RFP

    You get Receipt confirmed and a named bid lead

Every engagement starts with a written scope and a quote agreed before work begins. How each package is priced