

Capability 09 / 10Technology & Intelligence

Technology audits that show what to fix first and what each issue costs.

We audit software, SEO, security, data, AI readiness and cloud efficiency. Tools collect the evidence; a senior reviewer checks every finding. You get one register: each finding rated, costed where possible and placed in a fix order.

Findings register · Your company · combined audit · sample extract 37 findings Showing 8 of 37 · ranked by fix order

Severity summary for the sample register: 2 critical, 7 high, 12 medium and 16 low findings, 37 in total.

Sample findings register, scrollable sideways

An illustrative extract from a combined audit of “Your company”: eight findings with severity, estimated monthly cost, effort in engineering days and fix order. Figures are illustrative.
ID Area Finding Severity Monthly cost (est.) Effort Fix order
SEC-01 Security Admin console reachable from the public internet without MFA Critical Rated 2 d 1
TA-03 Performance Checkout LCP 4.6 s on mobile 75th percentile (target ≤ 2.5 s) High $18,400 8 d 2
SEC-04 Security Dependency with a known CVE in the payment service (CVSS 8.1) Critical Rated 1 d 3
DAT-02 Data Order events dropped when the queue backs up — 3.1% loss last month High $9,200 5 d 4
SEO-05 Search Product pages return 200 with a noindex tag from a legacy template High $11,700 3 d 5
CLD-02 Cloud Two oversized database instances idle above 80% of the month Medium $4,300 2 d 6
AI-02 AI readiness Knowledge base 40% duplicated — retrieval returns conflicting answers Medium Rated 6 d 7
ACC-01 Accessibility Checkout form fields without labels — WCAG 2.2 AA failure (1.3.1) High $7,600 4 d 8

Illustrative Costs are modelled from your analytics, cloud bills and engineering rates. Items marked Rated are risks we score but do not price, such as a breach. The 16 findings recommended for this quarter feed the fix-order planner below.

Typical length
2–6 weeks
Audit types
Technical · SEO · security · data · AI
Pricing
Scoped up front

01What we offer

Six audits, run alone or combined.

Each audit covers one area: software, SEO, security, data, AI readiness or cloud efficiency. All six follow the same evidence method and feed one register of findings.

Two monitors of source code on a dark desk, lit keyboards in front of them

Automated collection gives breadth; senior review gives depth.

Technical & performance

How your software is built, how fast it runs for users and how safely your team can change it.

What we examine

  • Architecture, service boundaries and coupling, against what the roadmap needs next
  • Code quality, test coverage, dependency age and licence exposure
  • Core Web Vitals from Chrome UX Report field data, alongside lab traces
  • Slowest 5% and 1% of server responses, query plans and N+1 queries
  • Delivery: DORA metrics, pipeline stages, rollback path, environment parity

Checks we run

  • Field LCP ≤ 2.5 s, INP ≤ 200 ms, CLS ≤ 0.1 at the 75th percentile
  • Load test to 3× peak traffic; find the first component to fail
  • Dependency tree scanned for known CVEs and abandoned packages
  • Change failure rate and time to restore from the last 90 days of releases

Rated against

  • Core Web Vitals — Loading, interactivity and visual stability
  • DORA metrics — Software delivery performance
  • WCAG 2.2 AA — Web Content Accessibility Guidelines

Tools

Typical length
2–4 weeks
Output
Architecture map, performance budget, ranked remediation backlog

SEO & AI visibility

Whether search engines can reach and rank your site, and whether AI answers cite it.

What we examine

  • Crawl budget, indexation, canonical logic, redirect chains and log-file evidence
  • Structured data validity and entity coverage against schema.org types
  • Content depth and topic gaps against the searches that convert
  • Citation share in ChatGPT, Perplexity and AI Overviews for your key prompts
  • Internal linking, orphan pages and rendering under JavaScript

Checks we run

  • Full crawl reconciled against Search Console coverage and server logs
  • Structured data validated; invalid or ignored types listed with the fix
  • 40 test questions across AI assistants, recorded with date and model
  • Rendered-HTML diff: what a crawler sees versus what a user sees

Rated against

  • Core Web Vitals — Loading, interactivity and visual stability
  • WCAG 2.2 AA — Web Content Accessibility Guidelines

Tools

Typical length
2–3 weeks
Output
Indexation report, entity and content gap list, citation baseline

Security & compliance

What an attacker can reach and do, and where you stand against the security frameworks you must meet.

What we examine

  • External attack surface: exposed hosts, ports, subdomains and forgotten environments
  • Application testing against the OWASP Top 10 and ASVS verification levels
  • Cloud settings against CIS Benchmarks: IAM, storage, network and logging
  • Identity: MFA coverage, privileged access, joiner-mover-leaver, session handling
  • Secrets in code and CI, dependency and container vulnerabilities, SBOM coverage

Checks we run

  • Authenticated and unauthenticated testing, under signed rules of engagement
  • Findings rated with CVSS v3.1 and re-rated for your environment
  • Container images scanned; base image age and critical CVEs reported
  • Gap analysis against ISO/IEC 27001 Annex A or SOC 2 Trust Services Criteria

Rated against

  • OWASP ASVS — Application Security Verification Standard
  • OWASP Top 10 — Web application security risks
  • CIS Controls v8.1 — Critical Security Controls and Benchmarks
  • ISO/IEC 27001:2022 — Information security management systems
  • SOC 2 — Trust Services Criteria

Tools

Typical length
2–4 weeks
Output
Vulnerability register with CVSS scores, security gaps, remediation plan

Data & analytics

Whether the numbers you decide on are right, where they come from and who can see them.

What we examine

  • Data quality: completeness, uniqueness, validity, timeliness, referential integrity
  • Lineage from source system to dashboard, and the transformations in between
  • Tracking accuracy: event loss, duplicate events, consent and server-side coverage
  • Governance: ownership, catalogue, retention, access reviews, personal-data classification
  • Warehouse cost and query efficiency, including the slowest and costliest data models

Checks we run

  • Profiling across every core table: null rates, duplicates, outliers, freshness
  • Front-end events reconciled against server-side records for one full month
  • Consent flows tested against GDPR and the DPDP Act 2023 requirements
  • Critical metrics traced from source to dashboard and recalculated independently

Rated against

  • GDPR — General Data Protection Regulation (EU) 2016/679
  • DPDP Act 2023 — Digital Personal Data Protection Act, 2023
  • ISO/IEC 27001:2022 — Information security management systems

Tools

Typical length
2–4 weeks
Output
Quality scorecard, lineage map, tracking fix list, governance gaps

AI readiness

Whether your data, platform, governance and people are ready for an AI programme before you fund one.

What we examine

  • Data readiness: coverage, quality, labelling, rights to use and refresh cadence
  • Infrastructure: how models are called, vector storage, cost per request, response-time budget
  • Governance: model inventory, approval gates, evaluation practice, audit logging
  • Skills and operating model: who owns models, who reviews output, who is on call
  • Use-case fit: value, feasibility and risk scored for each candidate use case

Checks we run

  • Test of AI answers from your own documents: faithfulness, grounding and relevance
  • Duplicate and contradiction rate across the knowledge base
  • Control mapping against the NIST AI RMF functions and ISO/IEC 42001 clauses
  • Prompt-injection probes on any existing assistant (OWASP LLM01)

Rated against

  • NIST AI RMF 1.0 — AI Risk Management Framework
  • ISO/IEC 42001:2023 — Artificial intelligence management systems
  • OWASP Top 10 for LLM Applications — Security risks in generative AI applications
  • EU AI Act — Artificial Intelligence Act (EU) 2024/1689

Tools

Typical length
3–4 weeks
Output
Readiness score by dimension, prerequisite list, ranked use cases

Carbon & efficiency

Where your systems waste cloud spend and emissions, two costs that almost always move together.

What we examine

  • Software Carbon Intensity (SCI) baseline per functional unit
  • Idle and oversized compute, unattached storage, cross-region transfer
  • Page weight, image payload, third-party scripts and cache hit ratio
  • Batch scheduling against grid carbon intensity where the region allows it
  • Model choice and running cost of any AI workload already in use

Checks we run

  • Cloud bill reconciled to workloads; waste separated from useful spend
  • Energy estimated per request, then converted with regional grid intensity
  • Transferred bytes per visit measured on the ten highest-traffic pages
  • Right-sizing modelled on 95th-percentile utilisation instead of peak

Rated against

  • SCI · ISO/IEC 21031:2024 — Software Carbon Intensity
  • ISO 14001:2015 — Environmental management systems

Tools

Typical length
1–2 weeks
Output
SCI baseline, waste register, efficiency backlog with cost and carbon

02Fix-order planner

A fix order that fits your team’s capacity.

The planner orders 16 sample findings into one quarter of engineering time. Change capacity or objective to see which fixes fit, the value they return and the risk left open.

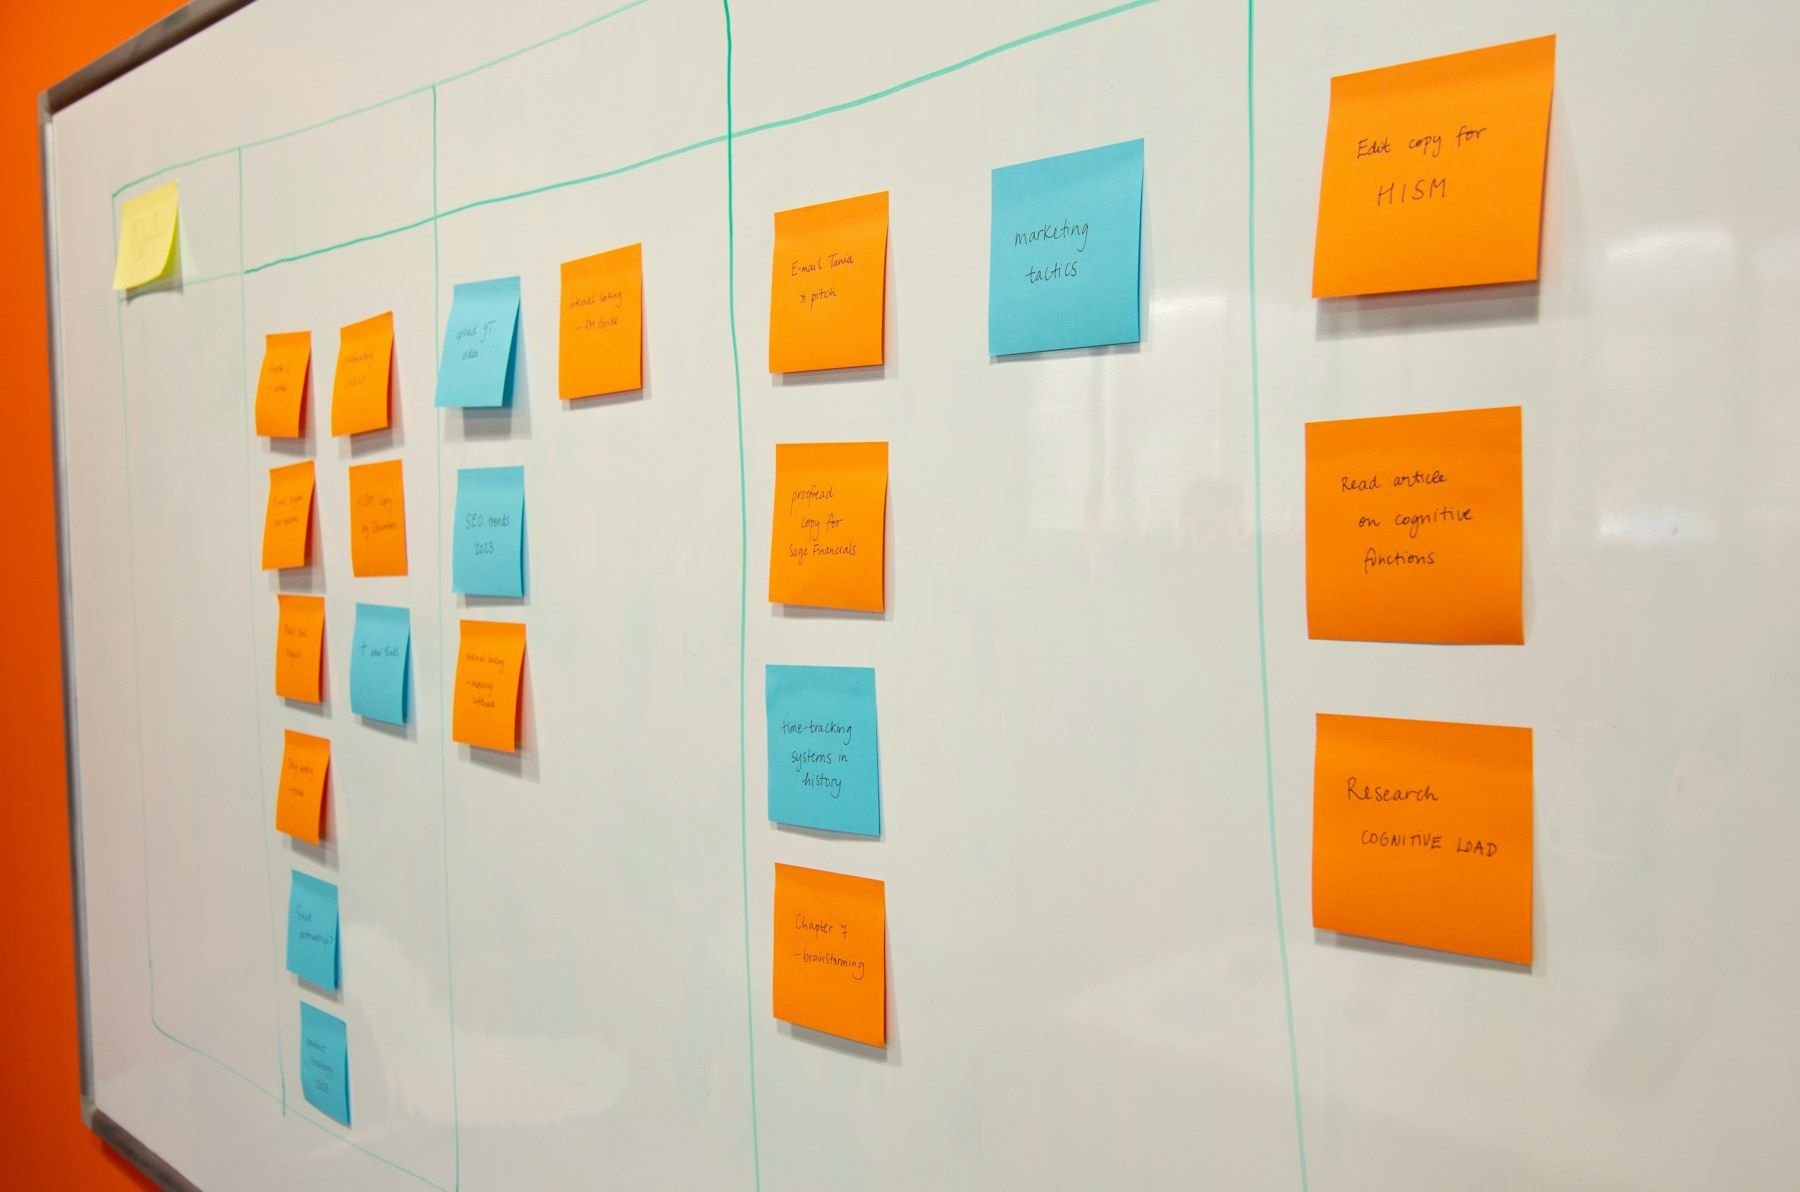
A whiteboard ruled into columns, with orange and blue sticky notes moving from left to right
Ordered, then costedFindings go up on the wall first, then into columns your team agrees to: now, next and later.Photo: Paymo / Unsplash
Fix-order planner · Your company · combined audit · the 16 findings scheduled this quarter · 55 engineering days in total Plan recalculated live
30 days

One engineer working the whole quarter is roughly 60 days. Effort figures are the audit’s own estimates, not a quote.

Objective

Days committed
28 of 30
Findings in the plan
11 of 16
Value recovered Est.
$41,900 per month
Left unfixed
28% of rated risk

Plan at 30 days, balanced objective: 11 findings selected, 28 days committed, 28% of rated risk left unfixed.

Now 5

First third of capacity

  • SEC-01Crit

    Admin console reachable from the public internet without MFA

    2 d Rated risk 20

  • SEC-04Crit

    Payment service ships a dependency with a known CVE (CVSS 8.1)

    1 d Rated risk 15

  • SEO-05High

    Product pages return 200 with a noindex tag from a legacy template

    3 d $11,700/mo

  • CLD-02Med

    Two oversized database instances idle above 80% of the month

    2 d $4,300/mo

  • CLD-05Low

    Non-production environments run 24/7, including weekends

    1 d $2,100/mo

Next 6

The rest of the plan

  • SEC-11High

    Cloud audit logging disabled in two of five accounts (CIS 3.1)

    2 d Rated risk 16

  • DAT-09High

    Personal data in analytics exports with no retention limit

    3 d Rated risk 16

  • ACC-01High

    Checkout fields without labels — WCAG 2.2 AA 1.3.1 failure

    4 d $7,600/mo

  • TA-11Med

    Product media served unresized, no modern formats, no edge cache

    3 d $6,100/mo

  • DAT-02High

    Order events dropped when the queue backs up — 3.1% loss last month

    5 d $9,200/mo

  • CAR-02Low

    Batch jobs scheduled at the daily grid carbon peak

    2 d $900/mo

Later 5

Does not fit this quarter

  • TA-03High

    Checkout LCP 4.6 s on mobile at the 75th percentile (good ≤ 2.5 s)

    8 d $18,400/mo

  • TA-08High

    No rollback path — every incident is resolved by a forward fix

    5 d Rated risk 12

  • SEO-09Med

    Structured data invalid on 62% of product pages — rich results lost

    4 d $5,400/mo

  • DAT-06Med

    Revenue reported three ways; no agreed definition or owner

    4 d Rated risk 12

  • AI-02Med

    Knowledge base 40% duplicated — retrieval returns conflicting answers

    6 d Rated risk 12

Cumulative value recovered against engineering days
$65,700/mo 55 days

The sixteen findings behind the plan, sortable, scrollable sideways

Sixteen illustrative findings with severity, risk score, estimated monthly value, effort, dependencies and the lane the current plan puts them in.
Finding Severity Depends on Must fix
SEC-04 Payment service ships a dependency with a known CVE (CVSS 8.1)Security 15/25 Critical Rated 1 d — Now
CLD-05 Non-production environments run 24/7, including weekendsCloud 10/25 Low $2,100 1 d — Now
SEO-05 Product pages return 200 with a noindex tag from a legacy templateSearch 20/25 High $11,700 3 d — Now
SEC-01 Admin console reachable from the public internet without MFASecurity 20/25 Critical Rated 2 d — Now
CLD-02 Two oversized database instances idle above 80% of the monthCloud 15/25 Medium $4,300 2 d — Now
SEC-11 Cloud audit logging disabled in two of five accounts (CIS 3.1)Security 16/25 High Rated 2 d — Next
TA-11 Product media served unresized, no modern formats, no edge cachePerformance 15/25 Medium $6,100 3 d — Next
ACC-01 Checkout fields without labels — WCAG 2.2 AA 1.3.1 failureAccessibility 20/25 High $7,600 4 d — Next
DAT-09 Personal data in analytics exports with no retention limitData 16/25 High Rated 3 d — Next
DAT-02 Order events dropped when the queue backs up — 3.1% loss last monthData 16/25 High $9,200 5 d — Next
TA-03 Checkout LCP 4.6 s on mobile at the 75th percentile (good ≤ 2.5 s)Performance 20/25 High $18,400 8 d TA-11 Later
CAR-02 Batch jobs scheduled at the daily grid carbon peakCarbon 8/25 Low $900 2 d CLD-02 Next
SEO-09 Structured data invalid on 62% of product pages — rich results lostSearch 12/25 Medium $5,400 4 d — Later
DAT-06 Revenue reported three ways; no agreed definition or ownerData 12/25 Medium Rated 4 d DAT-02 Later
TA-08 No rollback path — every incident is resolved by a forward fixDelivery 12/25 High Rated 5 d — Later
AI-02 Knowledge base 40% duplicated — retrieval returns conflicting answersAI readiness 12/25 Medium Rated 6 d — Later

Illustrative The sample register holds 37 findings. The planner carries the 16 recommended for this quarter: every critical and high finding, plus medium and low ones that are small or closely tied to scheduled work. The other 21 sit in the backlog appendix with the same fields. Risk is severity × likelihood, each scored 1–5, so 25 at most; vulnerabilities start from CVSS v3.1 and are re-rated for your environment. Value and Rated items follow the same rules as the register above. Effort is an engineering estimate with a stated confidence, and nothing is scheduled before the work it depends on.

03Method

Six steps from scope to recommended fix.

Scanners produce possible issues; an audit turns them into findings. Nothing is written up until a senior reviewer has reproduced it, rated it against a rubric and, where possible, costed it with your numbers.

  1. 01

    Scope

    Systems, owners, access and the decision the audit must inform. Security testing runs only under signed rules of engagement.

    • Audit charter
    • Access checklist
    • Rules of engagement
  2. 02

    Collect

    Automated scans, performance data, server logs, configuration exports, data profiling and interviews with the people who run your systems.

    • Scan output
    • Log sample
    • Interview notes
  3. 03

    Verify

    Each possible issue is reproduced by hand on a clean profile. Anything that cannot be reproduced is logged as a false positive and dropped.

    • Reproduction steps
    • Trace or screenshot
    • False-positive log
  4. 04

    Rate

    Severity and likelihood scored against a published rubric. Vulnerabilities start from their CVSS v3.1 base score, re-rated for your environment and exposure.

    • Severity
    • Likelihood
    • Rating rationale
  5. 05

    Cost

    Impact modelled from your traffic, conversion rate, cloud bill and engineering rates. Assumptions are written down and the result is given as a range.

    • Model inputs
    • Sensitivity range
    • Assumptions
  6. 06

    Recommend

    The fix, effort, dependencies, a named owner and the re-test that proves it closed, written so your team can do it without us.

    • Fix and effort
    • Owner
    • Re-test

The evidence chain runs Scope, Collect, Verify, Rate, Cost, Recommend. A marker showing finding TA-03 moves along it as the finding below collects its evidence.

TA-03 · Checkout LCP 4.6 s on mobile · evidence record Recommend
  • Scope Checkout funnel, mobile web, 28-day window
  • Field data CrUX p75 LCP 4.6 s — outside the good threshold of 2.5 s
  • Lab trace 6.1 s on a mid-range Android device over emulated 4G
  • Reproduced 5 of 5 runs on a clean profile, cache empty
  • Cause Third-party payment script loads in the head — 1.9 s of blocking time
  • Rating Severity High · Likelihood 5 · Risk 20 of 25
  • Cost model Conversion elasticity × mobile revenue — $18,400 a month, ±30%
  • Fix Defer the payment script until interaction, self-host the two web fonts, server-render the order summary
  • Effort 8 engineering days · depends on TA-11 · web platform team

Illustrative Nine evidence records attach to this one finding. The report carries them in an appendix, indexed by finding ID, so any number in the executive summary can be traced back to the thing it came from.

04Tools

The tools we use in each audit.

Each audit has its own tools, listed with what they measure and how much of the work they automate. Tools give breadth in hours; a person decides which findings matter to your business.

A black magnifying glass beside a small notebook and a pencil on a white desk
Measured, then judgedScanners and profilers read the code and the traffic; people read what they find.Photo: Mediamodifier / Unsplash

Technical & performance

65% automated · 35% expert review

A dial showing that about 65 per cent of the Technical & performance audit is collected automatically and the rest is manual review.

Lab and field performance data, load tests and static code analysis, read by an engineer.

Measured

  • Field Core Web Vitals at the 75th percentile, from Chrome UX Report
  • Slowest 5% and 1% of server responses, and their query plans
  • Test coverage, dependency age and known CVEs
  • Change failure rate and time to restore over 90 days

Estimated Modelled

  • Engineering effort to fix, with a confidence level
  • Revenue effect of faster pages, from how conversion changes with speed

AlsoWebPageTest · Chrome UX Report · Playwright traces · flame graphs

SEO & AI visibility

70% automated · 30% expert review

A dial showing that about 70 per cent of the SEO & AI visibility audit is collected automatically and the rest is manual review.

Crawlers, server logs and search consoles, plus a dated set of questions run through AI assistants.

Measured

  • Crawl and index status reconciled against server logs
  • Structured data validity per template
  • Rendered HTML versus source HTML
  • Citation share across a fixed set of questions, with model and date

Estimated Modelled

  • Traffic recovered from an indexation fix
  • Click-through gain from rich results

AlsoScreaming Frog · Chrome UX Report · server log analysis

Security & compliance

55% automated · 45% expert review

A dial showing that about 55 per cent of the Security & compliance audit is collected automatically and the rest is manual review.

Scanners map what is exposed; a tester decides what is reachable, what can be chained and what matters.

Measured

  • Hosts, ports, subdomains and forgotten environments reachable from outside
  • Known CVEs present in code, containers and base images
  • MFA coverage, privileged access and audit logging configuration
  • Cloud settings against CIS Benchmarks

Estimated Modelled

  • Likelihood of exploitation in your environment
  • Expected loss, modelled but not priced

AlsoOWASP ZAP · Nmap · Prowler · SBOM tooling

Data & analytics

60% automated · 40% expert review

A dial showing that about 60 per cent of the Data & analytics audit is collected automatically and the rest is manual review.

Profiling covers every core table; reconciling front-end and server records takes a person and a month of data.

Measured

  • Null rates, duplicates, outliers and freshness per table
  • Front-end events reconciled against server-side records
  • Lineage from source system to dashboard
  • Consent coverage and personal-data classification

Estimated Modelled

  • Hours lost to rework and manual reconciliation
  • The cost of a decision made on a wrong number

AlsoGreat Expectations · warehouse query logs · consent-mode diagnostics

AI readiness

40% automated · 60% expert review

A dial showing that about 40 per cent of the AI readiness audit is collected automatically and the rest is manual review.

The hardest audit to automate. AI answer quality can be measured; governance, skills and use-case fit need interviews and evidence.

Measured

  • Faithfulness, grounding and relevance of AI answers from your own documents
  • Duplicate and contradiction rate across the knowledge base
  • Model inventory, approval gates and audit logging
  • Prompt-injection probes against any existing assistant

Estimated Modelled

  • Readiness score per dimension against the rubric
  • Time and prerequisites before a first production use case

AlsoEvaluation sets · OWASP LLM Top 10 probes · control mapping sheets

Carbon & efficiency

75% automated · 25% expert review

A dial showing that about 75 per cent of the Carbon & efficiency audit is collected automatically and the rest is manual review.

Mostly cloud telemetry and billing data. SCI = ((E × I) + M) per functional unit R, with every input written down.

Measured

  • Energy drawn per workload from cloud telemetry
  • Bytes transferred per visit on the highest-traffic pages
  • 95th-percentile utilisation, idle hours and unattached storage

Estimated Modelled

  • SCI per functional unit, using regional grid intensity
  • Embodied emissions spread across the hardware in use

AlsoCloud Carbon Footprint · grid intensity data · billing exports

Technologies we work with across audits Tool licences are ours or yours, named in the audit charter before any tool runs.

  • SonarQube
  • Snyk
  • Lighthouse
  • PageSpeed Insights
  • k6
  • Google Search Console
  • Semrush
  • Burp Suite
  • Trivy
  • Datadog
  • Google Analytics
  • GitHub
  • Jira

05Scorecard

A scorecard your board can read.

Six dimensions, each scored 1–5 against a scale published before the audit starts. Each score describes what exists today and what the next level would need.

Radar shows

Maturity radar: security 2, speed 2, data 2, search 3, AI readiness 1 and carbon 1 out of 5 today, against a target of 4, 4, 4, 4, 3 and 3.
Today Target, 12 months
Overall today
1.8of 5
Overall at target
3.7of 5
  1. 1AbsentNothing in place, or it exists only in someone’s head.
  2. 2Ad hocIt happens when someone remembers, and differently each time.
  3. 3RepeatableDocumented, owned and repeated, but not measured.
  4. 4ManagedMeasured against a target, with alerts when it slips.
  5. 5OptimisedImproved on evidence, with each improvement confirmed by re-test.

Security & compliance

2 4 out of 5 today, target 4 out of 5

Level 2 · Ad hoc

MFA on some admin accounts, audit logging off in two of five cloud accounts, patching done on request.

Level 4 · Managed requires

MFA everywhere including break-glass, centralised audit logs with alerting, patch SLAs measured, cloud settings held against CIS Benchmarks.

Rated against
  • OWASP ASVS — Application Security Verification Standard
  • NIST CSF 2.0 — Cybersecurity Framework

Performance & accessibility

2 4 out of 5 today, target 4 out of 5

Level 2 · Ad hoc

Core Web Vitals measured in the lab only; checkout LCP 4.6 s on mobile at the 75th percentile; accessibility never tested.

Level 4 · Managed requires

Field Core Web Vitals good at the 75th percentile (LCP ≤ 2.5 s, INP ≤ 200 ms, CLS ≤ 0.1), a performance budget enforced in CI, WCAG 2.2 AA checked each release.

Rated against
  • Core Web Vitals — Loading, interactivity and visual stability
  • WCAG 2.2 AA — Web Content Accessibility Guidelines

Data & governance

2 4 out of 5 today, target 4 out of 5

Level 2 · Ad hoc

Revenue reported three ways, no metric owner, no catalogue, retention undefined and personal data in analytics exports.

Level 4 · Managed requires

One definition per critical metric with a named owner, quality tests running in the pipeline, retention and consent enforced and evidenced.

Rated against
  • DPDP Act 2023 — Digital Personal Data Protection Act, 2023
  • GDPR — General Data Protection Regulation (EU) 2016/679

Search & AI visibility

3 4 out of 5 today, target 4 out of 5

Level 3 · Repeatable

Indexation healthy on the main templates, structured data partial and invalid on product pages, no AI-citation baseline.

Level 4 · Managed requires

Templates validated every release, entity coverage complete, AI citation share tracked on a fixed, dated set of questions.

Rated against schema.org · Google Search Essentials

AI readiness

1 3 out of 5 today, target 3 out of 5

Level 1 · Absent

No model inventory, no evaluation set, knowledge base 40% duplicated, no agreed owner for model output.

Level 3 · Repeatable requires

Model inventory with approval gates, an evaluation set per use case, a deduplicated knowledge base with an owner, logged decisions.

Rated against
  • ISO/IEC 42001:2023 — Artificial intelligence management systems
  • NIST AI RMF 1.0 — AI Risk Management Framework

Carbon & efficiency

1 3 out of 5 today, target 3 out of 5

Level 1 · Absent

No energy or emissions baseline, two database instances idle for more than 80% of the month, page weight unbudgeted.

Level 3 · Repeatable requires

An SCI baseline published per functional unit, right-sizing reviewed monthly against 95th-percentile use, page weight budgeted and enforced.

Rated against
  • SCI · ISO/IEC 21031:2024 — Software Carbon Intensity

Illustrative Scores describe your systems at one point in time and are not a certificate. Certification to ISO/IEC 27001:2022, ISO/IEC 42001:2023 or SOC 2 comes from an accredited body after its own audit; we provide readiness, evidence and the work to close the gaps. Re-tests score the same six dimensions, so progress is measured the same way.

06Cost of inaction

The monthly cost of unfixed issues.

Severity alone rarely wins a budget, so we cost every finding that can be costed. Each figure shows its formula and uses inputs from your analytics, bills and engineering estimates.

Monthly digital revenue
$1.24Mthe baseline for the loss lines
Monthly cloud bill
$96,000of which 9.6% buys unused capacity
Remediation effort
31 eng. daysbehind these five lines, of 55 across the whole plan

The chart is a waterfall: five loss lines stack from zero to a recoverable total of $61,200 a month. Lost conversions are the largest at $18,400, then manual rework at $14,600, lost search visibility at $11,700, cloud waste at $9,200 and modelled risk exposure at $7,300. Select any bar for its formula and inputs.

Illustrative Monthly, in US dollars, for a fictional company. Select a bar — or move across them with the arrow keys — to open the calculation.

Lost conversions

Slow mobile checkout

$18,400per month

Formula

monthly loss = checkout sessions × Δ conversion rate × average order value 214,000 × 0.29% × $29.60 = $18,369
Inputs to the lost conversions calculation, with the source of each one.
InputValueSource
Mobile checkout sessions 214,000 / month Analytics, 28 days
Conversion at LCP ≤ 2.5 s 1.71% Analytics cohort, field LCP
Conversion at LCP 4.6 s 1.42% Analytics cohort, field LCP
Average order value $29.60 Order data, 90 days

Cohorts are split on field LCP from the Chrome UX Report, not on a lab score, so the difference is between real sessions. Core Web Vitals count as good at LCP ≤ 2.5 s, INP ≤ 200 ms and CLS ≤ 0.1 at the 75th percentile.

  • Measured inputs · modelled uplift
  • TA-03

Manual rework

Reconciling order and event data by hand

$14,600per month

Formula

monthly cost = rework hours × blended loaded hourly rate 380 h × $38.40 = $14,592
Inputs to the manual rework calculation, with the source of each one.
InputValueSource
Rework hours 380 / month Time log, three teams, 4 weeks
Blended loaded rate $38.40 / hour Your finance team
Largest single task Order reconciliation, 190 h Time log
Event loss driving it 3.1% of order events Queue metrics vs server truth

Rework is the cost of doing a task twice, not the cost of the team. Hours were logged by the people doing the work rather than estimated in a workshop.

  • Estimated from a four-week time log
  • DAT-02
  • AI-02

Cloud waste

Idle compute, unattached storage, transfer

$9,200per month

Formula

monthly waste = Σ (unused capacity × unit rate × hours) $5,690 + $2,288 + $1,220 = $9,198
Inputs to the cloud waste calculation, with the source of each one.
InputValueSource
Oversized instances 9, mean 61% unused p95 utilisation, 30 days
Blended instance rate $1.42 / hour × 730 h Cloud bill
Unattached block storage 26 TB at $0.088 / GB-month Cloud bill
Cross-region transfer 61 TB at $0.02 / GB Cloud bill

That is 9.6% of the monthly cloud bill spent on capacity nobody used. Right-sizing against p95 rather than peak also lowers the Software Carbon Intensity baseline, SCI = ((E × I) + M) per R, so the cost line and the carbon line move together.

  • Measured from the bill and utilisation
  • CLD-02

Risk exposure

Expected loss, not a price

$7,300per month · modelled

Formula

expected monthly loss = (annual likelihood × modelled impact) ÷ 12 (14% × $625,000) ÷ 12 = $7,292
Inputs to the risk exposure calculation, with the source of each one.
InputValueSource
Critical findings open 2 Findings register
Modelled annual likelihood 14% Exposure, exploit maturity, controls
Modelled impact $625,000 Response, notification, downtime, penalty exposure
Rating method CVSS v3.1, re-rated for context Security assessment

This line exists only so risk can be compared with revenue inside one fix order. A breach is a probability, not a monthly invoice, and the register still rates security findings with CVSS rather than pricing them. Penalty exposure is modelled against the India DPDP Act 2023.

  • Modelled · rated, not priced
  • SEC-01
  • SEC-04

Recoverable value

The five lines together

$61,200per month

Formula

recoverable value = Σ (the five lines above) $18,400 + $11,700 + $14,600 + $9,200 + $7,300 = $61,200
Inputs to the recoverable value calculation, with the source of each one.
InputValueSource
Recoverable per month $61,200 Modelled
Recoverable per year ≈ $734,400 Modelled, at a steady run rate
Share of monthly digital revenue 4.9% Against $1.24M / month
Remediation effort 31 engineering days Engineering estimates, ±30%

The planner above sequences the full 55-day plan, these five lines included, so the value arrives in the order that recovers the most soonest while respecting dependencies. Every figure on this page is illustrative and built for a fictional company.

  • Sum of the lines above

These five lines group the register's losses by where the money goes and add a modelled figure for the risk the planner rates but does not price. That is why $61,200 here and $65,700 in the planner describe one audit, counted two ways. Every line states its confidence: Measured was counted in your systems, estimated was sized by a person, modelled applies a probability. No cost is claimed without an input you can check.

07AI readiness

AI readiness, scored before you invest.

AI programmes often stall on data, governance and ownership. We score six dimensions against what your first production use case needs and list the work to close each gap.

The gap to a first production use case

Each dimension is scored 1–5 against a published rubric. The solid segment shows today’s score, the pale segment the shortfall and the dashed mark the level a first production use case needs. Each shortfall is sized in engineering days.

Prerequisite work, by dimension 35 engineering days
  • Data foundations 12 d
  • Governance 8 d
  • Security & privacy 6 d
  • Skills & operating model 5 d
  • Infrastructure 4 d

A strip showing the 35 engineering days of prerequisite work split by dimension: data foundations 12 days, governance 8, security and privacy 6, skills and operating model 5, infrastructure 4, use-case fit none. The same figures are listed below.

  1. 01

    Data foundations

    24 scores 2 of 5 today against a target of 4 of 5 12 eng. days

    EvidenceCore entities documented. 40% of the knowledge base is duplicated and freshness is unmonitored.

    Next actionDe-duplicate the knowledge base, then add freshness and null checks to the data pipeline.

    Data engineering DPDP Act 2023 — Digital Personal Data Protection Act, 2023
  2. 02

    Governance

    13 scores 1 of 5 today against a target of 3 of 5 8 eng. days

    EvidenceNo model inventory, no approval gate, no evaluation record. AI use is discovered after the fact.

    Next actionSet up a model register and an approval gate before the next pilot leaves a developer’s laptop.

    CTO office ISO/IEC 42001:2023 — Artificial intelligence management systems
  3. 03

    Security & privacy

    34 scores 3 of 5 today against a target of 4 of 5 6 eng. days

    EvidenceSSO and central logging in place. Prompts are neither tested for injection nor retained under a rule.

    Next actionRun prompt-injection probes against the OWASP Top 10 for LLM Applications and set a prompt retention rule.

    Security OWASP Top 10 for LLM Applications — Security risks in generative AI applications
  4. 04

    Skills & operating model

    24 scores 2 of 5 today against a target of 4 of 5 5 eng. days

    EvidenceTwo engineers experimenting. No named model owner, no review rota, no on-call path for failures.

    Next actionName a model owner, start a weekly output review, put model failure in the on-call runbook.

    Platform NIST AI RMF 1.0 — AI Risk Management Framework
  5. 05

    Infrastructure

    34 scores 3 of 5 today against a target of 4 of 5 4 eng. days

    EvidenceManaged cluster and a vector store are running. No cost-per-request budget, no latency objective.

    Next actionSet a cost-per-request budget and a 95th-percentile response-time objective before the first production agent.

    Platform
  6. 06

    Use-case fit

    44 scores 4 of 5 today against a target of 4 of 5 At target

    EvidenceThree candidates with a measured baseline; one has an owner and a budget. Already at target.

    Next actionNothing to close. Keep the baseline current so the first use case is judged against a measured starting point.

    Product

Illustrative 35 engineering days of prerequisite work across 5 dimensions before a first production use case is worth funding. Use-case fit is the only dimension already at target: the ideas are sound, but the foundations under them are not ready.

Profiling run · agent 04 · warehouse.analytics Complete 6.1M rows · 9 min
Data profiling output for five columns: null rate, duplicate rate, freshness and the flag raised. The bars share one scale from 0 to 45%.
Column Null rate Duplicate rate Freshness Flag
orders.order_id 0.0% 0.0% 2 min clean
orders.channel 12.8% 0.0% 2 min nulls
customers.email 0.4% 6.1% 2 min duplicates
events.session_id 3.1% 0.2% 5 min event loss
kb_articles.body 1.1% 40.2% 31 days duplicates · stale

Illustrative Agents run the profiling, cluster log errors and draft candidate findings in the first days. On this run the agent drafted 14 candidates; an analyst confirmed 9 and rejected 5 as false positives. Only the confirmed nine reached the register.

08Sample report

What the audit report looks like.

Five pages from a combined audit report. It is written for two readers: the board, in four pages, and the engineers who act on it, in as much detail as each fix needs.

  1. Combined technology auditConfidential

    Audit report · v1.0

    Combined technology audit

    Technical & performance · Security · Data & analytics · SEO & AI visibility · AI readiness

    Prepared for
    Your company
    Prepared by
    Xterra Edze
    Period
    Kick-off to readout
    Classification
    Named recipients only
    The corner of a glass office building against a deep sky, its lines converging upward
    Findings register · 37 findingsPage 01 of 42
  2. 1. Executive summaryConfidential

    Executive summary

    • 37 findings
    • Critical2
    • High7
    • Medium12
    • Low16
    • Two findings need attention this week: an admin console reachable from the public internet without MFA, and a known vulnerability in a payment-service dependency.
    • Checkout is the largest single revenue line. Mobile LCP is 4.6 s at the 75th percentile against a good threshold of 2.5 s, and the slower cohort converts 0.29 points lower.
    • Modelled recoverable value is $61,200 a month — 4.9% of monthly digital revenue — for 31 engineering days of remediation.
    • AI readiness is held back by governance rather than technology. There is no model register and no approval gate; the use cases themselves are sound.

    Recommendation. Take the Now lane — eleven engineering days — before the next release train. It closes both critical findings and recovers $20,900 a month without touching the checkout code path.

    Severity counts as at readoutPage 03 of 42
  3. 3.2 Findings · PerformanceTA-03

    TA-03 Checkout LCP is 4.6 s on mobile at the 75th percentile

    Severity
    High
    Component
    web / checkout
    Owner
    Web platform
    Effort
    8 eng. days
    Fix order
    02

    Evidence

    • Field data, 28-day window: LCP p75 4.6 s, INP p75 240 ms, CLS 0.04 (mobile)
    • Lab trace: 1.9 s blocked on a third-party payment script loaded in the head
    • Analytics cohort: 1.42% conversion above 4 s against 1.71% below 2.5 s
    • Filmstrip captured at 2.0 s, 3.0 s and 4.6 s (appendix E-014, E-015)

    Reproduction

    1. Throttle to Slow 4G on a mid-range Android profile
    2. Load /checkout cold, cache disabled, from a cold CDN edge
    3. Record LCP — the element is the order-summary card

    Rating rationale. High, not critical: revenue is affected continuously, but no data and no availability is at risk. Core Web Vitals count as good at LCP ≤ 2.5 s, INP ≤ 200 ms and CLS ≤ 0.1; this journey fails one of the three.

    Recommendation. Defer the payment script until interaction, self-host the two web fonts, and server-render the order summary. Re-test against field data after two weeks of collection, not against a lab score.

    Every finding carries evidence, reproduction, rationale and an ownerPage 14 of 42
  4. 5. Fix roadmapConfidential

    Fix roadmap — 30, 60, 90 days

    NowDays 0–30

    • SEC-01MFA and IP allow-listing on the admin console
    • SEC-04Patch the payment-service dependency, then re-scan
    • SEO-05Remove the legacy noindex from the product template
    • CLD-02Right-size two database instances against p95

    11 eng. daysRisk closed + $20,900 / month

    NextDays 31–60

    • TA-03Checkout LCP: defer the payment script, server-render the summary
    • DAT-02Durable queue with a dead-letter path for order events
    • ACC-01Label every checkout form field (WCAG 2.2 AA, 1.3.1)

    13 eng. days$33,000 / month

    LaterDays 61–90

    • AI-02De-duplicate the knowledge base, add freshness checks
    • GOV-01Model register and approval gate before the next pilot

    7 eng. daysPrerequisites for the AI programme

    Dependencies are respected: the payment dependency is patched before the checkout work touches the same service, and the knowledge-base clean-up precedes any retrieval build. Totals: 31 engineering days, $61,200 a month recovered on the model.

    Ordered by value per engineering day, dependencies respectedPage 28 of 42
  5. Appendix E · EvidenceConfidential

    Evidence appendix

    Evidence artefacts retained for the audit, with the instrument that produced each one, the day it was captured and the finding it supports.
    RefArtefactInstrumentCapturedFinding
    E-014 28-day field export, mobile Chrome UX Report Day 04 TA-03
    E-015 Lab trace and filmstrip Lighthouse Day 04 TA-03
    E-022 Authenticated scan report Burp Suite Day 09 SEC-01
    E-023 SBOM with CVE match, CVSS v3.1 Trivy Day 09 SEC-04
    E-031 Coverage export vs full crawl Search Console Day 11 SEO-05
    E-040 Profiling notebook, null and duplicate rates Python · Jupyter Day 12 AI-02

    Every artefact is handed over with the report and retained for twelve months. Raw scan output is never shipped: each line above was reproduced by a person before the finding it supports was written.

    6 of 148 artefacts shownPage 35 of 42

The five pages are shown as a stack with the current page in front and the next pages fanned behind it. Each page can also be opened from the index above.

Illustrative A sample document for a fictional company. The full report runs to roughly forty pages; about six are the executive summary and roadmap.

09How it works

Four weeks from access to an action plan.

Agents and automated scans cover every system in scope. Senior engineers then go deeper and reproduce each finding by hand.

Wk 01 → Wk 04 · 4 phases · 3 gates · readout in week four

Audit schedule · combined audit · four working weeks Evidence log open from day one Gates · 3

Schedule diagram: Scope runs in Wk 01; Investigate runs in Wk 01–03; Quantify runs in Wk 03–04; Report runs in Wk 04. An evidence log stays open across all four weeks. Three gates sit on the timeline — Access confirmed at the end of week 1. Draft walkthrough at the end of week 3. Readout workshop at the end of week 4.

  • End of week 1 Access confirmed Scope signed, credentials tested and rules of engagement agreed before any scan runs.
  • End of week 3 Draft walkthrough We check each finding with your engineers before writing it up and remove false positives.
  • End of week 4 Readout workshop Ninety minutes with leadership and delivery leads, ending with owners and dates for the fix order.
  1. 01Wk 01

    Scope

    Objectives, systems in scope, access, stakeholders and the decisions the audit has to inform.

    Outputs

    • Audit charter
    • Access checklist
    Run by
    Lead auditor · your sponsor
    Moves on only when
    Read access works end to end
  2. 02Wk 01–03

    Investigate

    Automated scanning, manual review, interviews and data analysis. Evidence captured for every finding.

    Outputs

    • Evidence log
    • Interview notes
    • Scan results
    Run by
    Agents · two senior engineers
    Moves on only when
    Every finding is reproduced by hand
  3. 03Wk 03–04

    Quantify

    Findings rated for severity and business impact, cost of inaction estimated, effort to fix sized and the backlog ranked.

    Outputs

    • Findings register
    • Impact model
    • Ranked backlog
    Run by
    Lead auditor · your finance lead
    Moves on only when
    You confirm the cost inputs
  4. 04Wk 04

    Report

    Executive summary, detailed findings and a 30-60-90-day plan, walked through with leadership and the engineering team.

    Outputs

    • Executive readout
    • Detailed report
    • 30-60-90 plan
    Run by
    Lead auditor · discipline leads
    Moves on only when
    Top findings have owners and dates

What we need from you

  • Read access Repositories, cloud consoles, analytics, search and monitoring. Read-only covers everything except agreed security testing.
  • Four to six hours Short interviews with the people who build and run your systems, spread over weeks one and two.
  • Rules of engagement A signed scope and testing window, agreed before any active security testing starts.

10What you get

Six handover files, each written for its reader.

The board gets the findings that need its decision, finance gets the cost model and engineers get the evidence and an import-ready backlog.

Handover · audits/your-company/2026-Q4/ 6 files Shared folder · your ownership
  1. 01

    Executive summary

    01_executive-summary.pdf

    The findings that need your decision, each with its cost and effort to fix.

    Deck · 2 pages Written for: Board, sponsor
  2. 02

    Detailed findings with evidence

    02_findings-detail.pdf

    Every finding with reproduction steps, evidence, the reason for its rating and a named owner.

    Report Written for: Engineering leads
  3. 03

    Scorecard by audit area

    03_scorecard.xlsx

    Six areas scored from one to five, each linked to its framework and the reason for the score.

    Dashboard Written for: Sponsor, audit lead
  4. 04

    Ranked remediation backlog

    04_remediation-backlog.csv

    Import-ready rows for Jira or Linear: title, severity, effort in days, dependencies and an acceptance test per item.

    Sheet · Jira Written for: Delivery teams
  5. 05

    Cost-of-inaction estimates

    05_impact-model.xlsx

    Open formulas built on your traffic, conversion, engineering rate and cloud figures, so changing an input updates every number.

    Model · Sheet Written for: Finance, sponsor
  6. 06

    30-60-90-day action plan

    06_30-60-90-plan.pdf

    The fix order planned against your team’s capacity, with owners, dependencies and the re-test date.

    Roadmap Written for: Sponsor, delivery

Sample paths File names are illustrative. The register also exports as CSV in the columns your tracker expects, ready to import.

Also in the handover

  • Session · 90 min

    Readout workshop

    Leadership and engineering review and challenge the findings together, then leave with an agreed fix order.

  • Archive · raw

    Evidence appendix

    Scan output, log extracts, query results, screenshots and interview notes, indexed by finding ID so any rating can be checked.

  • Report · comparison

    Re-test

    An optional re-run of the same checks after the fixes, reported against the baseline.

The re-test is scoped separately from the audit.

Formats you own
Sheets, CSV and PDF, with no portal, viewer licence or expiry date.
Evidence retained
We hold raw evidence for the period agreed in the engagement, then destroy it on request.
Reusable baseline
A later audit can be run against the same register and compared line by line.

11What changes

Audit outcomes, re-tested at 90 days.

At the readout we agree measures and targets with you, such as open critical findings, Core Web Vitals or cloud waste, so the re-test shows what the fixes changed.

Re-test comparison · Your company · baseline at readout, re-test at 90 days Same instruments, same sample Targets

Showing

Each bar is scaled inside its own row — the units differ by measure.

  1. Critical and high findings open count Baseline 7 Re-test target 1 −6
  2. Findings with a named owner and a date share of the register Baseline 18% Re-test target 100% +82 pts
  3. Key journeys passing Core Web Vitals of six, 75th percentile Baseline 2 / 6 Re-test target 6 / 6 +4 journeys
  4. Modelled monthly value recovered of the value identified Baseline $0 Re-test target $31,600 +$31,600 / month
  5. Cloud spend classified as waste share of the bill Baseline 9.6% Re-test target 3% −6.6 pts

Illustrative Figures are targets for a combined audit of a mid-sized platform, not results from a named engagement. Your baseline is measured in week one and the targets are agreed with you at the readout.

  1. 01

    A ranked list of fixes

    Findings ordered by impact and effort, so the first sprint of fixes is clear.

  2. 02

    Numbers leadership can use

    Cost of inaction and effort estimates that turn technical debt into a budget decision.

  3. 03

    An independent baseline

    A scored starting point to measure progress against, re-run in six or twelve months.

Same method as the baseline
Each measure is re-run with the same tool, sample and thresholds as the baseline, so the comparison holds.
Owned by your team
The re-test reports which findings your team closed, without reopening who should have closed them.
Value checked against the model
Recovered value uses the same model and your inputs, and any wrong assumption is corrected in both columns.

Services & packages

Audits and assessments for software, security, search, data, AI and cloud.

Independent audits that find what is wrong, estimate what it costs you and rank the fixes, in a report for leadership and engineers. Run one or several together.

Categories
04
Services
14
Packages
03
Not sure what you need? Describe the problem

How to buy

  1. 01Pick services. Enquire about one, or add several to a brief.
  2. 02Choose a package. A sprint, a fixed project or an ongoing team.
  3. 03Send the brief. We reply within one working day.

Browse by category

Timelines are typical. Every quote follows a written scope.

01Engineering audits

4 services
Typical timeline: 2–4 weeks

Technical & code audit

An independent review of your codebase and architecture: quality, security, test coverage, dependencies and how hard it will be to build what comes next.

What’s included

  • Code quality and maintainability review
  • Architecture and scalability review
  • Dependency and licence check
  • Test coverage and delivery pipeline review
  • Ranked remediation backlog
  • Code quality
  • Architecture
  • Tech debt

Best forBefore a funding round, acquisition, replatform or handover to a new vendor.

Typical timeline: 1–3 weeks

Performance audit

Find out why your site or app is slow for your users, using field data and load tests, and what each fix is worth.

What’s included

  • Core Web Vitals from field data against LCP ≤ 2.5 s, INP ≤ 200 ms and CLS ≤ 0.1
  • Back-end and database profiling
  • Load test to find the limits
  • Prioritised fixes with expected gains
  • Core Web Vitals
  • Load testing
  • Profiling

Best forSites and apps with slow pages or problems under load.

Typical timeline: 2–3 weeks

Delivery & DevOps assessment

Measure how quickly and safely your team releases software, using the four DORA metrics, and find what slows it down.

What’s included

  • DORA metrics: deployment frequency, lead time, change failure rate and time to restore
  • Pipeline and release process review
  • Environments and tooling review
  • Improvement roadmap
  • DORA metrics
  • CI/CD
  • Release process

Best forEngineering leaders whose releases feel slow or risky.

Typical timeline: 2–4 weeks

Technical due diligence

An independent technical assessment of a company, product or vendor before you invest in it, acquire it or depend on it.

What’s included

  • Architecture, code and security review
  • Team and process interviews
  • Scalability, cost and key-person risks
  • Findings written for investors or the board
  • Due diligence
  • M&A
  • Investment

Best forInvestors, acquirers and buyers of business-critical software.

02Security, compliance & accessibility

3 services
Typical timeline: 2–3 weeks

Security assessment

A risk-ranked check of your applications, cloud and access controls for vulnerabilities and weak settings, with active testing only under a signed scope.

What’s included

  • Vulnerability assessment
  • Cloud and identity configuration review
  • Threat model of critical systems
  • Risk-ranked findings and fixes
  • Vulnerabilities
  • Cloud configuration
  • Risk-ranked

Best forCompanies that have never had an independent security review.

Typical timeline: 2–4 weeks

Compliance gap assessment

Find how far you are from ISO/IEC 27001:2022, SOC 2 or the DPDP Act 2023. It prepares you for an audit; it is not a certification.

What’s included

  • Control-by-control gap analysis
  • Review of existing evidence
  • Effort estimate to close each gap
  • Roadmap to audit
  • ISO/IEC 27001:2022
  • SOC 2
  • DPDP Act 2023

Best forCompanies asked for compliance evidence by customers or regulators.

Typical timeline: 1–3 weeks

Accessibility audit (WCAG 2.2 AA)

Test your site or app against WCAG 2.2 Level AA, using automated tools and manual screen reader and keyboard testing, and get a fix list.

What’s included

  • Automated scans of key templates
  • Manual testing with assistive technology
  • Issues mapped to WCAG success criteria
  • Fix guidance in priority order
  • WCAG 2.2 AA
  • Manual testing
  • Screen readers
  • Playwright

Best forPublic-facing services and companies with accessibility obligations.

03Search, data & analytics audits

3 services
Typical timeline: 1 week

Website health check

A fast, combined check of speed, SEO, accessibility and security basics for one website, with the handful of fixes that matter most.

What’s included

  • Core Web Vitals and speed check
  • SEO and indexing basics
  • Accessibility spot checks
  • Security headers and exposure basics
  • Top fixes in priority order
  • Quick start
  • Speed · SEO · accessibility
  • Security basics

Best forSmall and mid-size businesses wanting a quick, low-risk first look.

Typical timeline: 2–3 weeks

SEO & AI visibility audit

Find why your site is not ranking or cited in AI answers: crawl and index issues, content gaps, structured data and how AI describes you.

What’s included

  • Technical crawl and index review
  • Content and keyword gap analysis
  • Structured data and entity check
  • AI answer visibility baseline
  • Prioritised action plan
  • SEO
  • AEO · GEO
  • Baseline
  • Ahrefs

Best forSites with falling organic traffic, or before a redesign.

Typical timeline: 2–4 weeks

Data & analytics audit

Check whether your data and reports can be trusted: tracking accuracy, data quality, metric definitions, lineage and consent handling.

What’s included

  • Tracking and tag review
  • Data quality and lineage checks
  • Metric definition review
  • Consent and privacy handling check
  • Data quality
  • Tracking
  • Consent
  • dbt

Best forTeams making decisions on numbers they do not fully trust.

04AI & cloud assessments

4 services
Typical timeline: 2–4 weeks

AI readiness assessment

Score how ready your data, systems, skills and governance are for AI, and list what to fix before the first build.

What’s included

  • Readiness score across data, infrastructure, skills and governance
  • Use-case readiness review
  • Risk and compliance check
  • Prerequisite roadmap
  • Readiness score
  • Prerequisites

Best forOrganisations planning an AI programme or a first AI build.

Typical timeline: 2–3 weeks

AI system review

An independent check of an AI feature or agent already in use: answer quality, safety, cost and oversight.

What’s included

  • Evaluation on your own examples
  • Prompt injection and data-leak checks against the OWASP Top 10 for LLM Applications
  • Cost and latency review
  • Governance and oversight review
  • Evaluation
  • OWASP LLM Top 10
  • Cost
  • OpenAI

Best forTeams with AI live and open questions about how well it works.

Typical timeline: 1–3 weeks

Cloud cost audit

Find where your cloud bill goes and how much of it can be saved, with each saving sized and risk-rated.

What’s included

  • Spend breakdown by service and team
  • Idle and oversized resources
  • Commitment and pricing options
  • Savings plan with estimates
  • FinOps
  • Savings plan
  • AWS
  • Microsoft Azure

Best forCompanies with a cloud bill growing faster than usage.

Typical timeline: 2–3 weeks

Cloud architecture & resilience assessment

Review how your cloud is built for reliability, security and recovery, including a test that your backups restore.

What’s included

  • Architecture review
  • Single points of failure
  • Backup restore test
  • Recovery target (RTO and RPO) gap analysis
  • Resilience
  • RTO · RPO
  • Restore test
  • AWS
  • Microsoft Azure

Best forBusinesses where an outage would be costly.

Your brief

Tick “Add to brief” on any service, choose a package, then continue. Or enquire about one service directly.

How we work with you

Ways to engage, from a question to an RFQ.

Ask a quick question, send a project brief or issue a formal RFQ. The lead for the work reads each one in full, and any services already in your brief go with it.

Or book a thirty-minute call

What are you sending?

  1. 01

    About 2 minutes4 required answers

    For a first conversation, a press request or anything that does not need a scope yet.

    You get A reply from a named lead

  2. 02Recommended

    About 8 minutes5 short steps

    Goals, audiences, a budget band and timing, so our first reply can outline the work.

    You get Options and a first scope after one call

  3. 03

    About 15 minutesYour documents attached

    Your documents, deadlines and the procurement and security rules the work must meet.

    You get Receipt confirmed and a named bid lead

How it is priced

Each package shows its pricing model. Work starts once a written scope and quote are agreed.

  • Typical length
    1–3 weeks
    Pricing
    Fixed fee
  • Typical length
    4–12 weeks
    Pricing
    Fixed price
  • Typical length
    6–18 months
    Pricing
    Programme fee · by statement of work
Compare what each package includes
What each package includes and who it suits
PackageEvery engagement includesBest for
SprintA short, fixed-scope engagement that answers one defined question.
  • Scope and outcome agreed before day one
  • A senior lead plus the specialists needed
  • A working review every week
  • A decision-ready answer or prototype
Discovery, a diagnostic, a prototype or a decision you need to make soon
ProjectA defined scope, delivered for a fixed price.
  • Statement of work with deliverables and acceptance criteria
  • A named project lead and a fixed team
  • A shared plan with dated checkpoints
  • Source files, yours once paid for
Work you can describe up front: an identity, a platform or a set of tools
EnterpriseA multi-workstream programme with a dedicated team, governance and agreed service levels.
  • An engagement director and a steering group
  • A dedicated team across several workstreams
  • Service levels, reporting and a risk register
  • Security, legal and procurement reviews in the plan
Large organisations running change across markets, portfolios or business units

12Questions

Audit questions from our scoping calls.

Short answers on method, access, safety, security testing, how findings are priced and what happens after the audit.

  • 01

    How is this different from an automated scan?

    Method

    A scan lists issues; an audit tells you which ones matter. We use scanners too, then add senior review, context from your team, the business impact of each finding and a ranked plan for this quarter.

  • 02

    What access do you need?

    Access

    Read access to code repositories, cloud consoles, analytics and the relevant tools, plus a few hours with the people who build and run the systems. Security testing happens only under a signed scope and rules of engagement.

  • 03

    Will it disrupt production?

    Safety

    No. Data collection is read-only, scans are rate-limited and load-generating checks are scheduled with your team. Load and active security tests run outside production or in a window agreed in writing. Nothing that could affect a live service runs until a named person on your side approves it.

  • 04

    Will you tell us things we do not want to hear?

    Independence

    Yes. The value of an audit is its independence. Findings are evidenced and discussed with your team before the report, but they are not softened.

  • 05

    Is a penetration test included?

    Security testing

    Not a formal one. The security audit tests your application and cloud setup against the OWASP Top 10, OWASP ASVS and CIS Benchmarks, under signed rules of engagement. Findings are rated with CVSS v3.1. A formal penetration test with an attestation letter for customers or insurers is a separate engagement; attestations and certificates come from accredited bodies, never from us.

  • 06

    Can you audit a system another vendor built?

    Vendors

    Yes. We need read access and whatever documentation exists. Findings describe the system without blaming the supplier. Each comes with reproduction steps and an acceptance test, so you can hand it to that supplier as a work order.

  • 07

    How do you put a number on a finding?

    Numbers

    With your own figures, and only where a cost can be modelled. Revenue findings use your analytics: affected sessions, conversion rate, average order value and the modelled uplift. Waste findings use your cloud bill and tool spend. Risk findings are rated by severity and likelihood; we do not price them. Every input is visible and editable in the model.

  • 08

    Can you fix what you find?

    After the audit

    Yes, or your team can. The backlog is written so anyone can execute it. If we do the work, it is scoped separately so the audit stays independent of the fix.

  • 09

    Which audit should we start with?

    Scope

    The one closest to the decision you face: a replatform, an AI programme, a funding round, a compliance deadline or falling organic traffic. Several audits can run together and share one backlog.

Tell us what you need built.

You will speak to a lead who would run the work, and get a straight answer on fit.

Book a call

Three ways to start

Every engagement starts with a written scope and a quote agreed before work begins.

Choose one of the three ways above