What we do · 05 · Product & Experience Design

Product, UX and UI design tested with your users before you build.

Product strategy, user research, UX and UI design and design systems, tested with users before full build. We run user research, set product strategy, design the UX and UI and build the front end. Results are measured against a baseline agreed at the start.

Capabilities
5
Process
Research → release
Built to
WCAG 2.2 AA

Illustration: a plan-change screen for “Your platform”, half grey wireframe and half finished interface, with the interview quote behind the idea and a usability result: five of six participants completed the task unaided.

What we offer

Five product capabilities, bought alone or together.

Each is scoped and delivered on its own. Used together, each passes its evidence to the next: strategy comes with its research, design with its test results.

01 / 05 · Consulting

Options tested and costed

Design Consulting & Solutioning

Options for using new technology, shaped into a plan your teams can build.

  • Experience & capability assessment
  • Solution shaping
  • Design sprints
02 / 05 · Strategy

What to build next

Product Strategy & Vision

Research-backed product vision, prototype and roadmap that set what to build next.

  • Product discovery
  • Opportunity mapping
  • Product vision & main measure
Typical length · 6–10 weeks Explore Strategy — Product Strategy & Vision
03 / 05 · Experience

Designed, tested, built

Experience Design & Development

UX and UI design tested with users in moderated sessions before full build.

  • User research & usability testing
  • Information architecture & journeys
  • Interaction & interface design
04 / 05 · AI Product

From idea to live feature

AI Product Strategy & Development

AI features, models and agents designed into your product and tested before launch.

  • AI opportunity mapping
  • AI interaction patterns
  • Prototyping on live models
Typical length · 4-week concept · 12-week build Explore AI Product — AI Product Strategy & Development
05 / 05 · Systems

Product & Experience Design

System Design

Design systems in Figma and code, so teams build new screens without redrawing them.

  • Foundations & design tokens
  • Component library in code
  • Multi-brand & multi-platform theming
Typical build · 8–16 weeks to v1 Explore Systems — System Design

Why now

Product decisions cost least to change before the build starts.

Each step from sketch to live code makes a decision harder to reverse. We test the costliest assumptions in sketches and prototypes and hand the evidence to the build team.

Relative cost to change one decisionLog scale · illustrative
1× 2× 4× 8× 30× 100× Where we work
Chart: the relative cost of changing a decision rises from 1× at the research stage to about 2× at journey, 4× at wireframe, 8× at prototype, 30× in build and 100× once live. Illustrative order of magnitude.
  • 01

    Roadmaps built on opinion

    The loudest request wins a quarter of engineering time, and nobody wrote down what would prove it wrong.

  • 02

    Research that arrives too late

    Findings arrive after the design is signed off, so they can only shape the next release.

  • 03

    Untested AI features

    A demo on five prompts goes live, and the first sign of trouble is a support ticket.

  • Our approach

    Name each assumption and test it with the simplest sketch or prototype that can answer it. The evidence stays with the decision.

How it works

One product idea, from customer interviews to release.

Step through five stages of one illustrative idea. Six pieces of evidence become a journey, a wireframe, a tested prototype and a release. Each assumption moves from “untested” to “measured”.

Idea 014 · Self-serve plan changeRelease

The canvas shows the same six blocks at each stage: interview quotes, then a journey from noticing the need to the plan being changed, then a wireframe and a prototype of a plan-change screen with a “what changes” panel, then the released screen.

Stage 05 of 05 · Staged rollout · product analytics

Release and measure

Released to 10% of users, then to everyone. Plan-change contacts are tracked against the baseline for four weeks.

Confidence in the bet86%
Assumption tracker
AssumptionStateEvidence
A1People want to change plan without talking to anyone validated Self-serve completion 94% (illustrative)
A2Downgrades are mainly about price invalidated Closed
A3Fear of losing data blocks the switch validated Panel viewed in 71% of changes
A4Self-serve cuts plan-change contacts by 30% measuring −41% at week 4 · target −30%

Illustrative example. Participant counts, ticket volumes and results show what we measure; they are not client results.

How we work with you

Six stages, each with an evidence check.

Each stage ends with a question answered with evidence before budget moves to the next. You can start at whichever stage your product is in.

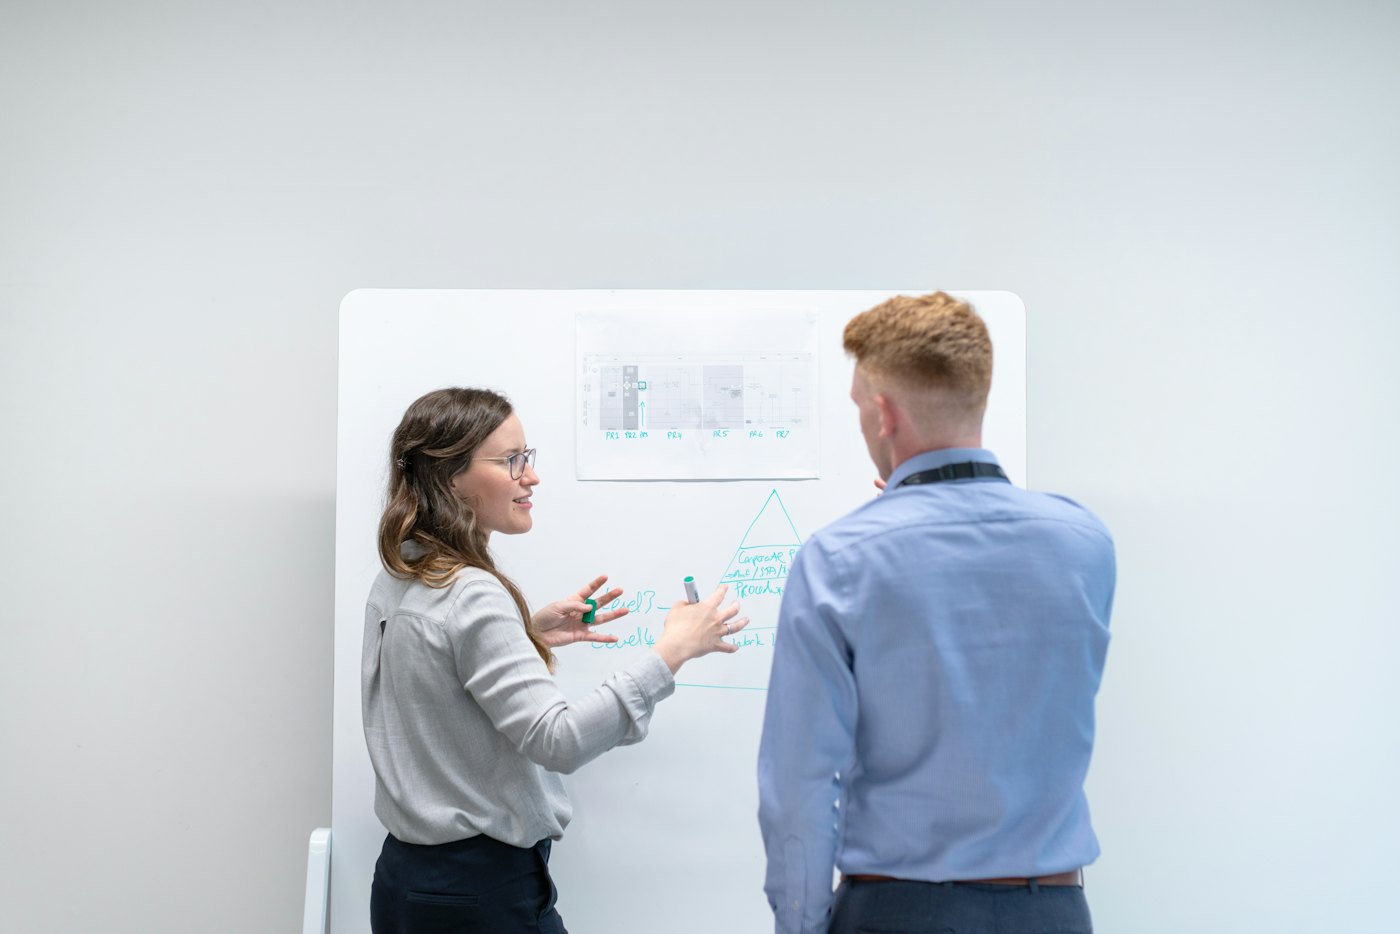
An engineer sketches a system diagram on a whiteboard during a working session
Design · sized with engineers

Timings are typical for all six stages and shorten when you start at a later stage.

  1. Frame Week 1

    We name the decision the work supports and the assumption most likely to break it, then agree the measure of success.

    • Decision brief
    • Assumption map
    • Baseline

    Gate · Is the question worth answering?

  2. Discover Weeks 1–4

    Interviews, analytics, support tickets and a review of what exists, tagged in one evidence base so every finding keeps its source.

    • Evidence base
    • Opportunity map

    Gate · Is there a problem worth solving, and for whom?

  3. Design Weeks 2–6

    Journeys, information architecture and wireframes for each option, drawn to equal depth and sized with the engineers who would build them.

    • Journeys
    • Wireframes
    • Effort & risk

    Gate · Can we build it, and at what cost?

  4. Test Weeks 3–8

    Prototypes tested with your users. For AI features, the evaluation set runs before anyone sees a demo.

    • Prototype
    • Session clips
    • Evaluation results

    Gate · Did people complete the task?

  5. Build Weeks 6–16

    Front end and components built from the design system, with accessibility and performance checks on every change and a staged release.

    • Components
    • Accessibility report
    • Release plan

    Gate · Does it meet the bar we agreed?

  6. Measure Ongoing

    We review results against the week-one baseline with your team. What we learn starts the next round.

    • Outcome dashboard
    • Decision record

    Gate · Keep, change or retire?

How we use AI

Agents do the sorting. Named people decide.

We use AI to gather, sort and check evidence. It never approves its own work: a named person reviews every theme, prompt and release.

  • Research synthesis

    An agent groups transcripts into themes linked to their quotes; a researcher approves, merges or rejects each one.

  • Prototypes on live models

    AI features are prototyped on the live model and realistic data, so tests show the answers users would get, wrong ones included.

  • Evaluations before demos

    Every AI feature gets a versioned evaluation set: expected behaviour, refusals and failure cases, run on each prompt or model change.

  • Design quality checks

    Automated contrast, target-size and keyboard checks run on every component change; a person reviews what automation cannot judge.

Illustration of an AI research-synthesis run: 24 transcripts are redacted for personal data, 312 quotes are tagged and 5 themes are proposed; a researcher approves three, rejects one and merges one, and the run is logged with the model, prompt version and reviewer.

  • Personal data redacted before any AI model sees it
  • A named person approves every output
  • Every theme links to its quotes
  • Model, prompt version and reviewer logged

What changes

Design systems where one fix reaches every product.

Decisions flow from tokens to components, patterns and surfaces, with an automated check at each step. New screens use parts that have already passed those checks.

01 · Tokens

ColourSemantic roles, contrast-checked pairs
Type & spaceOne scale, every breakpoint
MotionDurations, easing, reduced-motion
Contrast pairs ≥ 4.5 : 1

02 · Components

Figma libraryVariants and every state
Code packageSame names, same props
DocsUsage, do and don’t
Keyboard & screen-reader tests

03 · Patterns

FlowsSign-up, checkout, plan change
AI statesLoading, low confidence, refusal
ContentVoice, errors, empty states
Visual regression on each change

04 · Surfaces

WebReact · Next.js
iOS & AndroidSwiftUI · Jetpack Compose
Email & in-appThemed from the same tokens
Adoption tracked per team

The capability pages use the same diagram for research operations, AI evaluation and operating models.

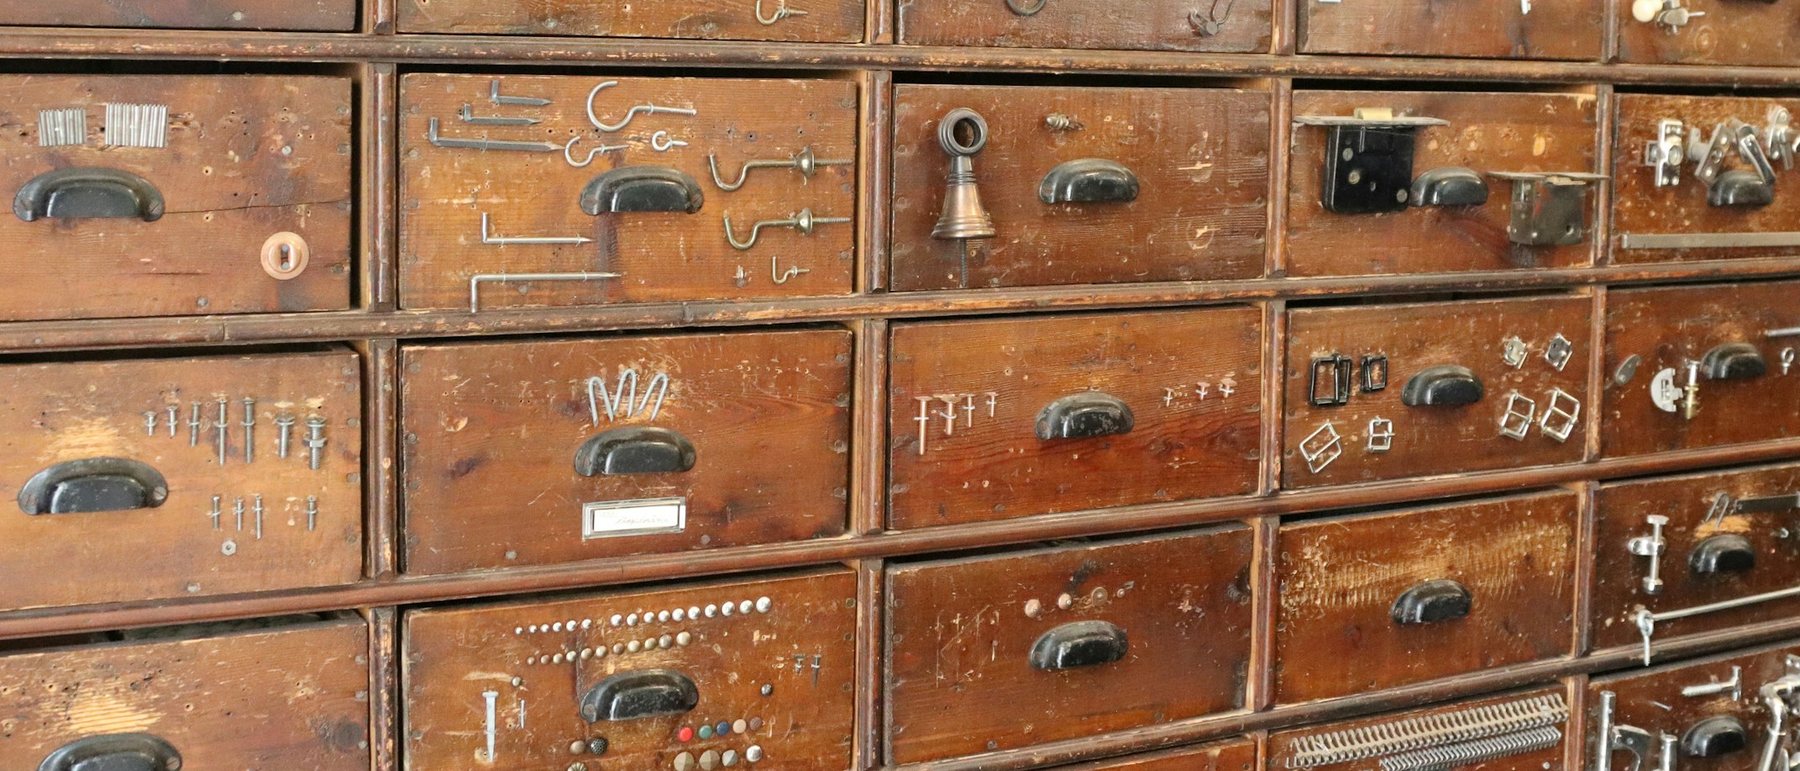
A wall of old wooden drawers, each showing the hooks, hinges or catches it holds on its front
One libraryevery part labelled by what it is

Tools we use

Your tools first, ours only where you have none.

We work in your teams’ tools and hand everything over in them. These are the technologies we use most for research, design, build and measurement.

01

Research & strategy

Evidence, journeys and decisions in one place.

  • Figma
  • Miro
  • Notion
  • Confluence
  • Jira
  • Linear
02

Design & build

One library in design and in code.

  • Storybook
  • React
  • Next.js
  • TypeScript
  • Tailwind CSS
  • Swift
  • Kotlin
  • GitHub
  • GitHub Actions
03

Test & measure

Usability, accessibility, performance and behaviour.

  • Playwright
  • Cypress
  • Jest
  • Lighthouse
  • PostHog
  • Mixpanel
  • Google Analytics
  • Looker
04

AI features

Models chosen per task by tests on your own examples.

  • Anthropic
  • OpenAI
  • Google Gemini
  • LangGraph
  • LlamaIndex
  • Python

How we check quality

The standards we build to, and where each is checked.

Our design and front-end work is built to these frameworks. They are not certifications we hold; each is a set of checks we run and record.

Every product

  • WCAG 2.2 AAWeb Content Accessibility Guidelines

    Level AA by default: 4.5 : 1 text contrast, focus never hidden behind sticky UI (2.4.11), targets at least 24 × 24 px (2.5.8) and a single-pointer alternative to every drag (2.5.7).

    Checked inAutomated component tests · manual screen-reader pass

  • Core Web VitalsLoading, interactivity and visual stability

    Speed budgets set during design and measured at the 75th percentile of visits: LCP ≤ 2.5 s, INP ≤ 200 ms, CLS ≤ 0.1.

    Checked inLighthouse CI · field data

  • GDPRGeneral Data Protection Regulation (EU) 2016/679

    Consent, purpose and retention for every research recording and every analytics event we propose.

    Checked inConsent log · retention schedule

  • DPDP Act 2023Digital Personal Data Protection Act, 2023

    India’s Digital Personal Data Protection Act, 2023: notice, consent and individuals’ rights designed into each flow.

    Checked inConsent and notice patterns

  • ISO 9001:2015Quality management systems

    Quality-management principles applied to delivery: documented stages, gate reviews and logged corrective actions.

    Checked inGate reviews · decision records

When AI is in the product

  • EU AI ActArtificial Intelligence Act (EU) 2024/1689

    People are told when they are interacting with AI, and the risk tier is decided while the feature is still a sketch.

    Checked inDisclosure patterns · risk note

  • NIST AI RMF 1.0AI Risk Management Framework

    The four functions (govern, map, measure, manage) applied to discovery, evaluation and post-launch monitoring.

    Checked inEvaluation set · monitoring plan

  • ISO/IEC 42001:2023Artificial intelligence management systems

    The design records an AI management system asks for: intended use, oversight and change history.

    Checked inDesign documentation

  • OWASP Top 10 for LLM ApplicationsSecurity risks in generative AI applications

    Prompt injection (LLM01) and excessive agency (LLM06) handled in the interface: untrusted content labelled, consequential actions confirmed by a person.

    Checked inRed-team cases in the evaluation set

What you get

Working files, handed over in your tools.

Each engagement ends with a handover of evidence, decisions and files. What we make for you is yours once it is paid for. Tools we already had stay ours, and you get a free, permanent licence to use them.

/handover/01-consulting/

Design Consulting & Solutioning

  • Capability assessment & scorecardDeck · Sheet
  • Current-state experience mapFigma
  • Solution options with trade-offsDocument · Figma
  • Prototype used for testingFigma · coded
  • Effort, cost & risk modelSheet
  • Target operating model & DesignOps planDocument
  • Phased roadmap & decision recordRoadmap · ADR

/handover/02-strategy/

Product Strategy & Vision

  • Product visionOne page · Deck
  • Opportunity map & evidence packBoard · Sheet
  • Main measure & input treeSheet · Dashboard
  • Business case per betModel · Sheet
  • Sequenced roadmap · now / next / laterRoadmap · Board
  • Vision prototypeFigma · film
  • Assumption & experiment backlogSheet

/handover/03-experience/

Experience Design & Development

  • Research plan, findings & session clipsReport · clips
  • Journey maps & information architectureFigma
  • Interface designs with every stateFigma
  • UX copy & content guidelinesDoc · Figma
  • PrototypesFigma · coded
  • Front-end code & componentsYour repos · Storybook
  • Accessibility report & fixesWCAG 2.2 AA
  • Usability benchmarkSheet · Dashboard

/handover/04-ai-product/

AI Product Strategy & Development

  • AI opportunity map across the journeyBoard · Figma
  • AI interaction pattern setFigma · Storybook
  • Prototype on live modelsCoded prototype
  • Evaluation set & resultsDatasets · report
  • Trust & disclosure guidelinesDocument
  • Production AI featureSource · your cloud
  • Adoption & quality dashboardDashboard

/handover/05-systems/

System Design

  • Interface inventory & auditSheet · Figma
  • Design tokensJSON · platform exports
  • Figma libraryFigma
  • Component package in codeYour repos · package
  • Documentation siteStorybook
  • Accessibility acceptance criteriaPer component
  • Versioning & contribution modelDocs
  • Adoption dashboardDashboard

/handover/README

In every handover

  • Decision record, with evidence linksDoc
  • Assumption tracker, final statesSheet
  • Research consent & retention logSheet
  • Walkthrough session, recordedVideo

Outcomes

Usability and adoption, measured before and after.

Before design starts, we agree a baseline and a target for each measure. Both readings use the same method, so the comparison is fair.

  1. Baseline firstMeasured on the current product in week one.
  2. Same methodThe same tasks, survey or events after release.
  3. Reviewed at every gateWith your team, in your analytics tools.
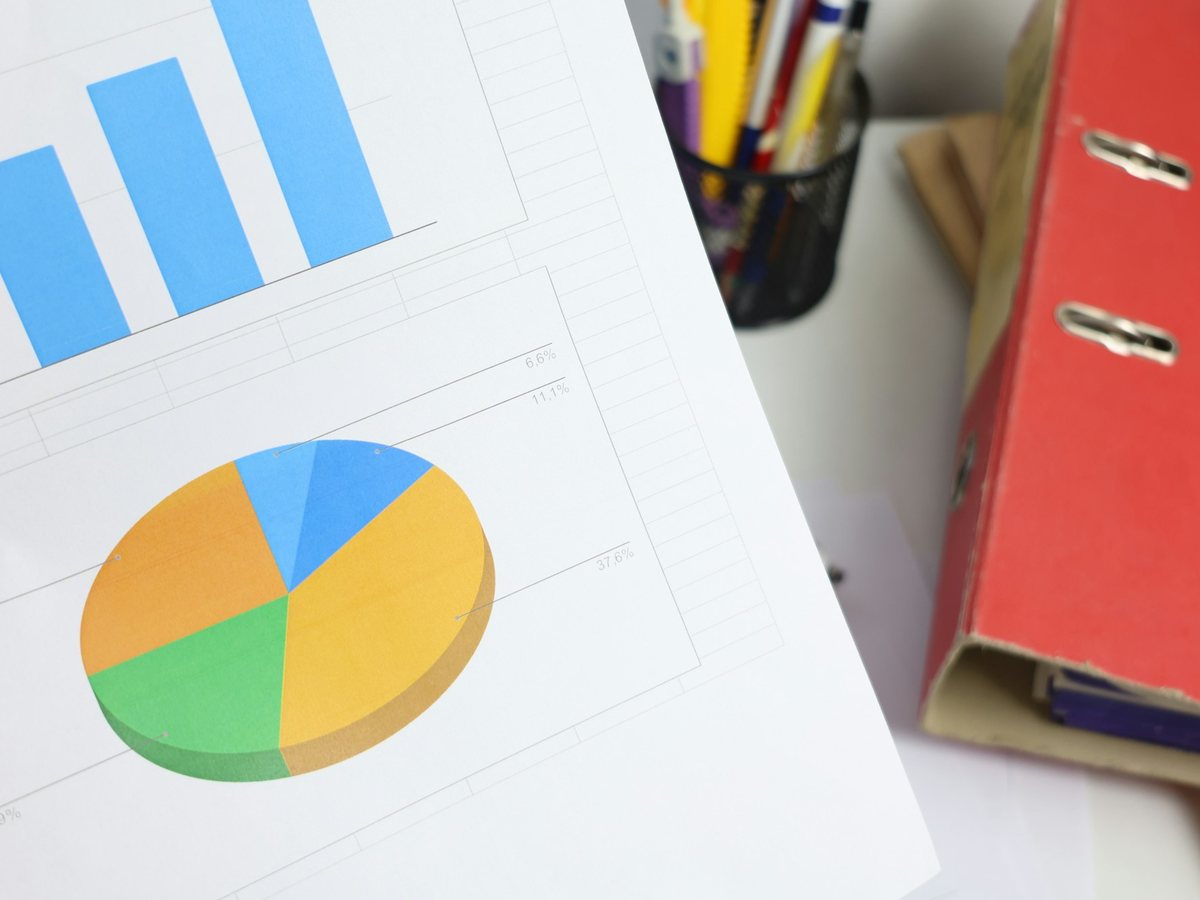
A printed report of bar and pie charts on a desk beside a pen pot and a red ring binder
The same methodbefore and after
Outcome review · Your productIllustrative
  • Task completion, key journeysUnmoderated test, same tasks before and after
    90%from 64%target 85%
  • Perceived usability (UMUX-Lite)Two-item survey after the task, 0–100
    79from 58target 75
  • WCAG 2.2 AA criteria metAutomated checks plus a manual audit
    100%from 71%target 100%
  • AI answers accepted uneditedLogged accept, edit and reject events
    82%from 55%target 80%
  • Screens built from design-system componentsCode scan of component imports
    85%from 20%target 80%
  • New-feature users active in week 4Product analytics cohort
    41%from 18%target 35%
Scale 0–100 on every row. Figures are illustrative examples of the measures we set, not client results.

Services & packages

Product services, from audits to embedded squads.

Choose a service and your enquiry reaches the right team with it attached. Each can be bought as a sprint, a fixed-scope project or ongoing capacity.

Categories
05
Services
21
Packages
06
Not sure what you need? Describe the problem

How to buy

  1. 01Pick services. Enquire about one, or add several to a brief.
  2. 02Choose a package. A sprint, a fixed project or an ongoing team.
  3. 03Send the brief. We reply within one working day.

Browse by category

Timelines are typical. Every quote follows a written scope.

01Assess & advise

4 services
Typical timeline: 2–4 weeks

Product experience audit

An independent review of your live product: where people get stuck, what your analytics show and which fixes to make first.

What’s included

  • Expert review of the key journeys
  • Analytics and support-ticket review
  • Accessibility and performance spot checks
  • Ranked backlog with effort and impact
  • Diagnostic
  • Ranked backlog

Best forTeams who know the product is underperforming but not where.

Explore Design Consulting & Solutioning
Typical timeline: 3–5 weeks

Solution shaping & options

Two or three routes to the same outcome, each drawn as a journey and system sketch and sized with engineers for a fair comparison.

What’s included

  • Current-state journey and system map
  • Two or three routes at equal depth
  • Effort, cost and risk range for each
  • A recommendation with the rejected options recorded
  • Options
  • Decision-ready

Best forLeadership teams about to commit budget to a large build.

Explore Design Consulting & Solutioning
Typical timeline: 1–2 weeks

Design sprint

One or two weeks to turn a rough idea into a prototype your customers have tried, before anyone is assigned to build it.

What’s included

  • Framing session with the decision makers
  • Concept work and a clickable prototype
  • Five to eight customer sessions
  • A go, adjust or stop recommendation
  • 1–2 weeks
  • Tested with users

Best forTeams stuck between competing ideas and short of evidence.

Explore Design Consulting & Solutioning
Typical timeline: 2–5 weeks

Accessibility audit (WCAG 2.2 AA)

Your website or app tested against WCAG 2.2 AA, automatically and by hand, with each failure explained and ranked by how much it blocks people.

What’s included

  • Automated scan across key templates
  • Manual keyboard and screen-reader passes
  • Findings mapped to WCAG 2.2 success criteria
  • Prioritised fix backlog and retest
  • WCAG 2.2 AA
  • Manual testing
  • Playwright

Best forOrganisations with a procurement, tender or policy requirement to meet.

Explore Design Consulting & Solutioning

02Strategy & vision

4 services
Typical timeline: 4–6 weeks

Product discovery

Research with your customers and data to find what is worth building next, before a roadmap is written around it.

What’s included

  • Customer and lost-customer interviews
  • Analytics, support and sales data read together
  • Opportunity map with sizing
  • Shortlist of bets with evidence attached
  • Research-led
  • Opportunity map

Best forProduct teams with more ideas than evidence.

Explore Product Strategy & Vision
Typical timeline: 3–5 weeks

Product vision & main measure

A clear statement of where the product is going, with the one measure that shows it is working and the inputs teams can move.

What’s included

  • Vision on one page
  • Main measure and the inputs that drive it
  • Alignment sessions with leadership
  • Narrative for the board and the team
  • Vision
  • Main measure

Best forProducts where each team has a different idea of the goal.

Explore Product Strategy & Vision
Typical timeline: 3–5 weeks

Roadmap & sequencing

A now, next and later roadmap ordered by evidence and dependency, with the assumption behind each item written down for testing.

What’s included

  • Scored and sequenced opportunities
  • Dependencies and capability gaps
  • Measures and owners per item
  • Assumption and experiment backlog
  • Now · next · later
  • Owners & measures

Best forTeams whose roadmap has become a wish list.

Explore Product Strategy & Vision
Typical timeline: 4–8 weeks

Vision prototype

A prototype or short film of the product two years out, used to align leadership and test the idea with customers and investors.

What’s included

  • Concept development with your leadership
  • High-fidelity prototype or film
  • Customer reaction sessions
  • Narrative and presentation pack
  • Concept
  • Alignment

Best forLeadership teams raising money, realigning a portfolio or entering a new category.

Explore Product Strategy & Vision

03Design & research

5 services
Typical timeline: 8–16 weeks

Complete UX & UI design

The full design of a product or a major journey: structure, screens, content and every state, tested with users as it is drawn.

What’s included

  • Information architecture and journeys
  • Interface design with empty, loading and error states
  • UX writing for labels, guidance and errors
  • Testing rounds through the project
  • Developer handover with acceptance criteria
  • UX · UI
  • Tested
  • Handover-ready

Best forTeams building a new product or rebuilding a journey that is failing.

Explore Experience Design & Development
Typical timeline: 10–20 weeks

Product or app redesign

A redesign of an existing product, planned for release in stages behind feature flags.

What’s included

  • Baseline usability benchmark
  • Journey-by-journey redesign plan
  • Designs and prototypes per stage
  • Migration and rollout plan
  • Benchmark repeated after release
  • Staged rollout
  • Benchmarked
  • Playwright

Best forProducts that have grown past their original design.

Explore Experience Design & Development
Typical timeline: 2–5 weeks per round

User research & usability testing

Sessions with the people who use your product, planned around your open decisions and written up so the findings settle them.

What’s included

  • Research plan tied to open decisions
  • Recruitment and incentives handled
  • Moderated or unmoderated sessions
  • Findings, clips and a prioritised list of fixes
  • Moderated
  • Unmoderated
  • Clips

Best forTeams making a decision that nobody can settle from the data alone.

Explore Experience Design & Development
Typical timeline: 6–16 weeks

Front-end build

The designed experience built as accessible, fast front-end code in your repositories, with the checks that keep it that way.

What’s included

  • Component-based front end in React and TypeScript
  • Automated accessibility and visual regression tests
  • Core Web Vitals budgets enforced on merge
  • Design QA pass before release
  • React
  • WCAG 2.2 AA
  • Core Web Vitals
  • Playwright

Best forTeams with finished designs and no front-end capacity to build them.

Explore Experience Design & Development
Typical timeline: 3–6 weeks

UX writing & content design

The words inside the product rewritten with the design: labels, guidance, empty states, errors and confirmations that people understand the first time.

What’s included

  • Content audit of the key journeys
  • Rewritten interface copy in the designs
  • Error and edge-case message set
  • Content guidelines for the team
  • Microcopy
  • Guidelines

Best forProducts where support keeps answering the same question.

Explore Experience Design & Development

04AI in the product

4 services
Typical timeline: 2–4 weeks

AI opportunity mapping

Where AI helps in your product and where it would only add friction, judged journey by journey.

What’s included

  • Journey review for AI use cases
  • Value, feasibility and risk score per idea
  • Data and content readiness check
  • Shortlist with a first use case to prototype
  • Journey-led
  • Scored

Best forProduct teams under pressure to add AI without a clear reason yet.

Explore AI Product Strategy & Development
Typical timeline: 3–6 weeks

AI prototype on live models

A working prototype connected to live models and your own content, so the idea is judged on what the model returns.

What’s included

  • Interaction patterns designed for the task
  • Prototype on live models and your content
  • Sessions with the people who would use it
  • Findings, costs and a build or stop recommendation
  • Live models
  • Tested with users
  • OpenAI

Best forTeams deciding whether an AI feature is worth a quarter of engineering.

Explore AI Product Strategy & Development
Typical timeline: 8–14 weeks

AI feature design & build

An AI feature designed and released in your product, with disclosure, sources, an undo and a person approving anything consequential.

What’s included

  • Interaction design including the failure states
  • Connection to your documents and systems
  • Evaluation set and release thresholds
  • Feedback capture and a quality dashboard
  • Released
  • Evaluated
  • Human review
  • OpenAI
  • LlamaIndex

Best forProducts ready to put an AI feature in front of customers.

Explore AI Product Strategy & Development
Typical timeline: 4–8 weeks

AI interaction pattern set

Reusable patterns for AI features: streaming answers, citations, confidence, suggestions versus actions, undo and handing over to a person.

What’s included

  • Pattern set with usage guidance
  • Disclosure and transparency rules
  • Components added to your design system
  • Review checklist for new AI features
  • Design system
  • Reusable

Best forOrganisations where several teams are building AI features at once.

Explore AI Product Strategy & Development

05Systems & teams

4 services
Typical timeline: 10–20 weeks

Design system build

Tokens, components and documentation built once in Figma and code, so teams assemble new screens from existing parts.

What’s included

  • Interface inventory of what exists today
  • Design tokens exported to each platform
  • Component library with states and accessibility
  • Documentation site and contribution path
  • Figma + code
  • Versioned
  • Documented

Best forOrganisations where several teams keep rebuilding the same components.

Explore System Design
Typical timeline: 4–10 weeks

Design tokens & theming

One shared set of colour, type, spacing and motion values, themed for several brands or markets on the same components.

What’s included

  • Token structure and naming
  • Themes per brand, product or market
  • Exports for web, iOS and Android
  • Light, dark and high-contrast modes
  • Tokens
  • Multi-brand
  • Multi-platform

Best forGroups running more than one brand or product on shared components.

Explore System Design
Typical timeline: 4–8 weeks

Design operations set-up

How your design team takes in, reviews and hands over work, set up so quality does not depend on who is on the call.

What’s included

  • Intake, prioritisation and critique sessions
  • Design QA and handover standards
  • File, library and naming structure
  • Research repository and participant process
  • DesignOps
  • Ways of working

Best forDesign teams too large to coordinate in one conversation.

Explore Design Consulting & Solutioning
Typical timeline: Ongoing · monthly

Embedded product design squad

Designers, researchers and front-end engineers working inside your team, on your backlog, at your cadence.

What’s included

  • Named specialists matched to your roadmap
  • Your tools, meetings and repositories
  • Scale the team up or down each month
  • Knowledge transfer built in from week one
  • Squad
  • Time & materials

Best forProduct teams with a clear roadmap and too few senior people.

Explore Experience Design & Development

Your brief

Tick “Add to brief” on any service, choose a package, then continue. Or enquire about one service directly.

How we work with you

Ways to engage, from a question to an RFQ.

Ask a quick question, send a project brief or issue a formal RFQ. The lead for the work reads each one in full, and any services already in your brief go with it.

Or book a thirty-minute call

What are you sending?

  1. 01

    About 2 minutes4 required answers

    For a first conversation, a press request or anything that does not need a scope yet.

    You get A reply from a named lead

  2. 02Recommended

    About 8 minutes5 short steps

    Goals, audiences, a budget band and timing, so our first reply can outline the work.

    You get Options and a first scope after one call

  3. 03

    About 15 minutesYour documents attached

    Your documents, deadlines and the procurement and security rules the work must meet.

    You get Receipt confirmed and a named bid lead

How it is priced

Each package shows its pricing model. Work starts once a written scope and quote are agreed.

  • Typical length
    1–3 weeks
    Pricing
    Fixed fee
  • Typical length
    4–12 weeks
    Pricing
    Fixed price
  • Typical length
    3–9 months
    Pricing
    Fixed price per milestone
  • Typical length
    Ongoing · 6-month minimum
    Pricing
    Monthly fee
  • Typical length
    6–18 months
    Pricing
    Programme fee · by statement of work
  • Typical length
    Ongoing · 3-month minimum
    Pricing
    Time & materials
Compare what each package includes
What each package includes and who it suits
PackageEvery engagement includesBest for
SprintA short, fixed-scope engagement that answers one defined question.
  • Scope and outcome agreed before day one
  • A senior lead plus the specialists needed
  • A working review every week
  • A decision-ready answer or prototype
Discovery, a diagnostic, a prototype or a decision you need to make soon
ProjectA defined scope, delivered for a fixed price.
  • Statement of work with deliverables and acceptance criteria
  • A named project lead and a fixed team
  • A shared plan with dated checkpoints
  • Source files, yours once paid for
Work you can describe up front: an identity, a platform or a set of tools
MilestoneA larger build in phases you approve and pay for one at a time.
  • Phases with their own scope, output and sign-off
  • A go or no-go review at every gate
  • Re-planning between phases as you learn
  • Payment tied to accepted milestones
Programmes too large for one contract, where you want control at each step
RetainerReserved monthly capacity to run, improve and extend what we built.
  • A reserved block of team time every month
  • Agreed response times for requests and fixes
  • A monthly review and a rolling backlog
  • Planned improvements as well as upkeep
Live brands and products that need a steady team without hiring one
EnterpriseA multi-workstream programme with a dedicated team, governance and agreed service levels.
  • An engagement director and a steering group
  • A dedicated team across several workstreams
  • Service levels, reporting and a risk register
  • Security, legal and procurement reviews in the plan
Large organisations running change across markets, portfolios or business units
SquadA dedicated team that works inside your stack and sprint schedule.
  • Named specialists matched to your roadmap
  • Works in your tools, meetings and backlog
  • Scale the team up or down each month
  • Knowledge transfer built in from week one
Teams with a clear roadmap that need more senior people quickly

Questions

Asked before the first workshop.

Anything else goes to the team that would do the work.

Enquire
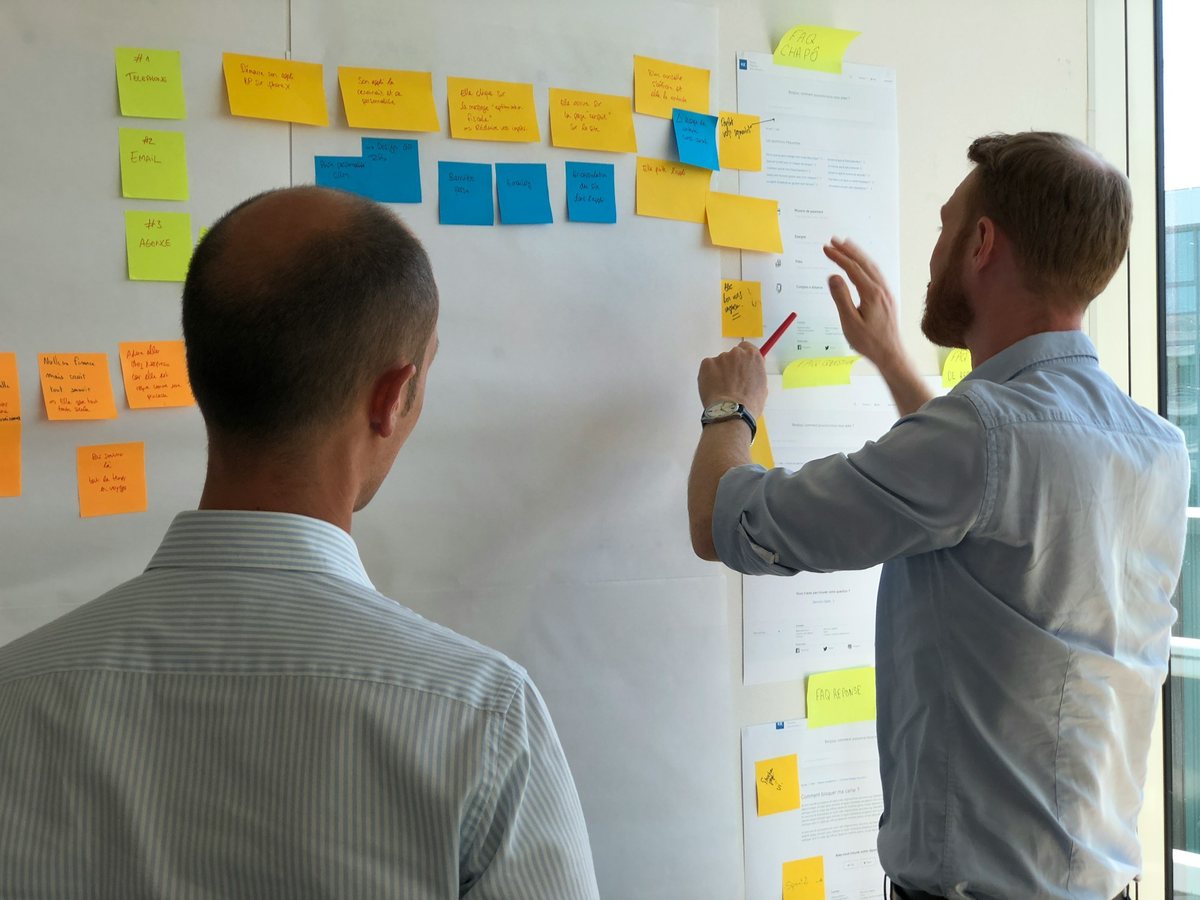
Two colleagues talk through a wall of sticky notes and printed pages
The working wallquestions answered in front of the evidence
Q01Do we have to start with research?

No. You can start wherever your product is: a strategy question, a design to test, a front end to build or a design system to consolidate. We test only the open assumptions that matter to your next decision.

Q02Will you work with our designers and engineers?

Yes. We work in your Figma, code repositories and ticketing tools alongside your people. At handover your team gets the working files and decision record, so it can carry on without us.

Q03How is consulting different from a discovery project?

Consulting ends in a decision; discovery ends in a scoped build plan. Consulting starts from a choice you face, discovery from a problem to explore. One often leads to the other, so we scope them separately to keep the advice independent of the build.

Design Consulting & Solutioning
Q04How is this different from writing a roadmap?

A roadmap says what and when; a strategy explains why. It shows why these bets beat the alternatives, what must be true for each to work and what you will stop doing. We write both, strategy first.

Product Strategy & Vision
Q05How many users do you need to test with?

Five to eight people per round, testing one journey. That finds most usability problems, so we run several small rounds. Benchmarks and preference tests need larger samples, and we say which we are running.

Experience Design & Development
Q06How is this different from the AI work in Technology & Intelligence?

This capability designs the product; Technology & Intelligence engineers the AI underneath. Engineering covers the models, document search, agents and infrastructure. Design decides where AI belongs in the journey, what people see and how the feature is tested with users. Most AI products need both, and the two teams work as one.

AI Product Strategy & Development
Q07How is this different from Brand Systems in Brand Design?

Brand Systems sets the rules; System Design makes them buildable in products. Brand Systems covers expression, assets and tone on every channel. System Design covers your product’s tokens, components, states and versioning, in Figma and in code.

System Design

Tell us what you need built.

You will speak to a lead who would run the work, and get a straight answer on fit.

Book a call

Three ways to start

Every engagement starts with a written scope and a quote agreed before work begins.

Choose one of the three ways above